Introduction to Visualisations in Galaxy
Visualizations are vital for the interpretation of large datasets. Galaxy has numerous visualization options available.
What is Data Visualisation?
- Making graphics to clearly convey data
- Many different options
- More than just scatter plots and bar charts
- Many domain-specific
- Protein folding, network graphs, trees, genome browsers
Go Up
Why visualizations?
-
A picture is worth 1000 words
-
Anscombe’s Quartet. All these datasets share the same basic statistics: same mean, standard deviation and correlation, yet when visualizing them it is revealed they have vastly different structures.
X mean: 54.26, X SD: 16.76
Y mean: 47.83, Y SD: 26.93
Correlation: -0.06
Go Up
Data Visualisation in Galaxy
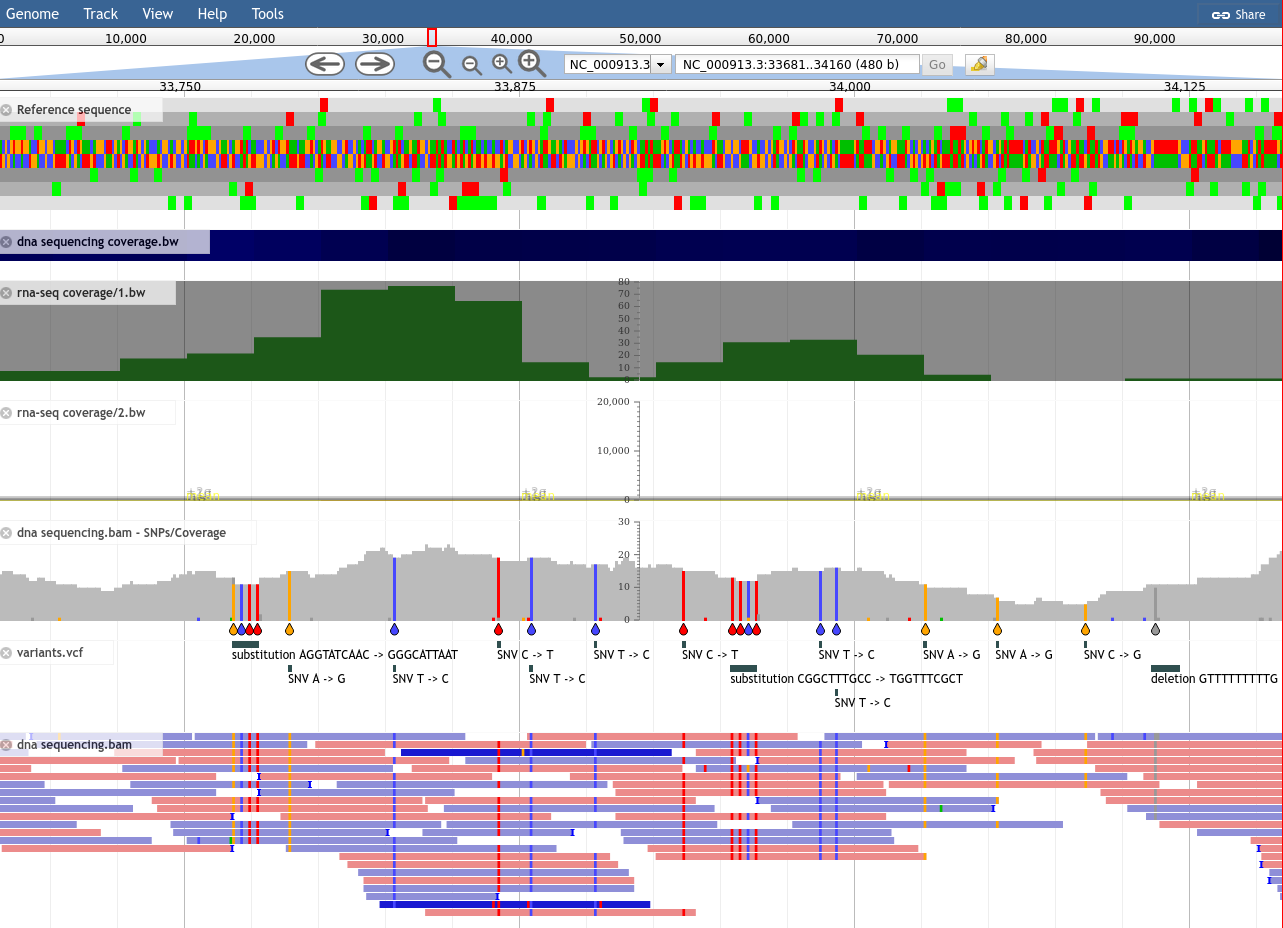
Genome Browsers
- Visualize the genome
- mapped sequence reads, variants, genes, ..
Go Up
Genome Browsers in Galaxy
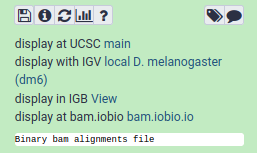
- As display applications
- e.g. UCSC browser, IBV, IGB, ..
- accessed via links on dataset
Go Up
JBrowse
JBrowse is not a display application like the previous examples- Genome browser as a regular tool
- Configure your settings
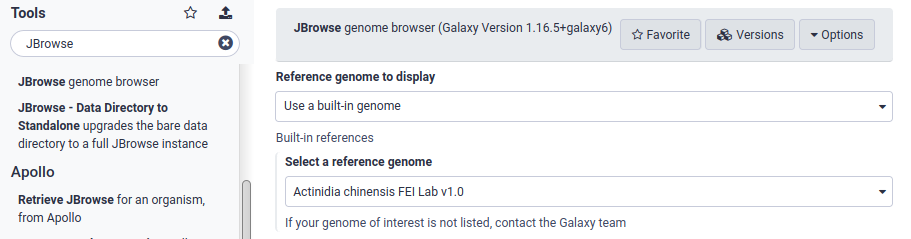
- Then interactively explore your genome
Go Up
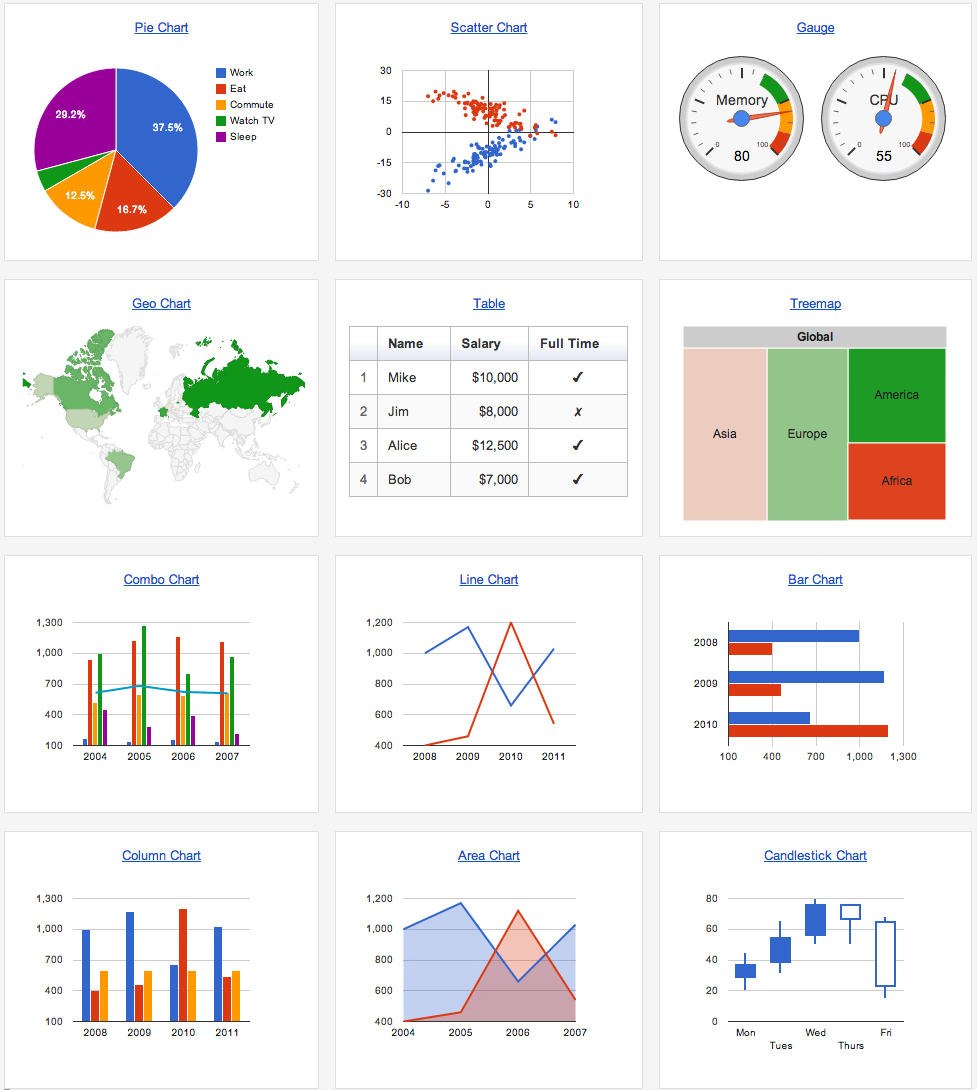
Galaxy Charts
- Accessed through Charts icon on dataset
- Different options depending on datatype
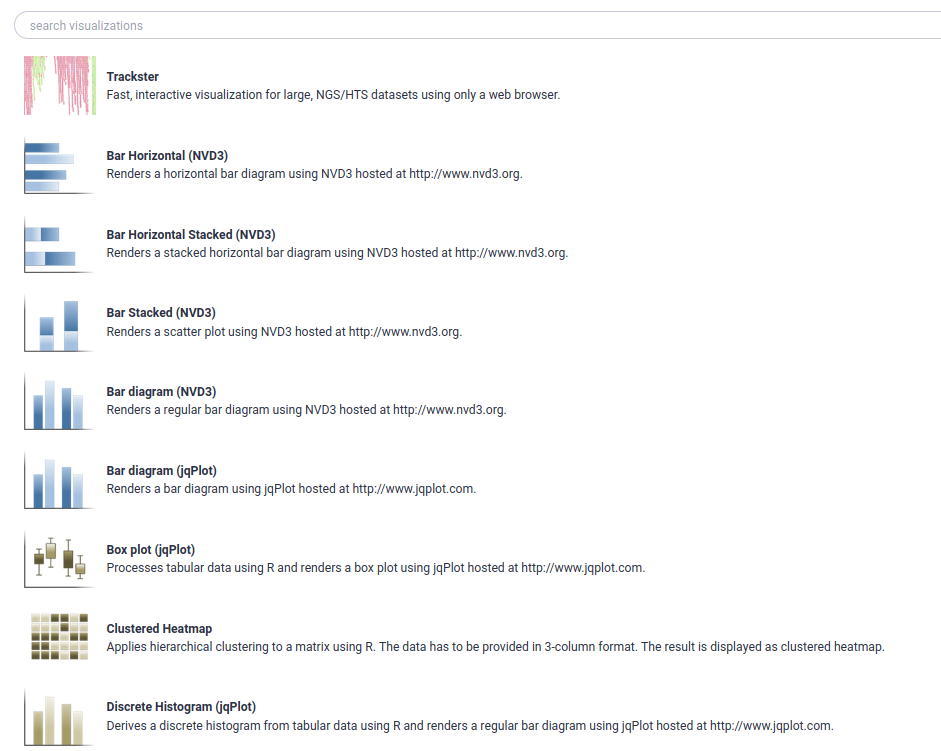
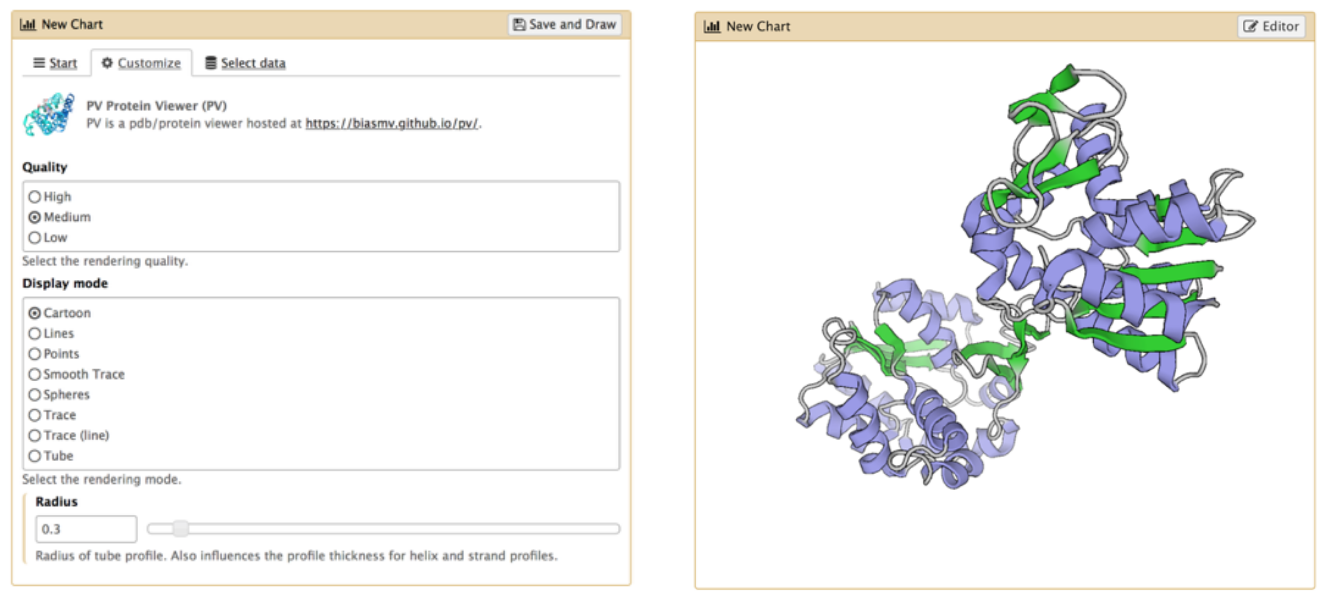
- After selecting chart type, can customize settings
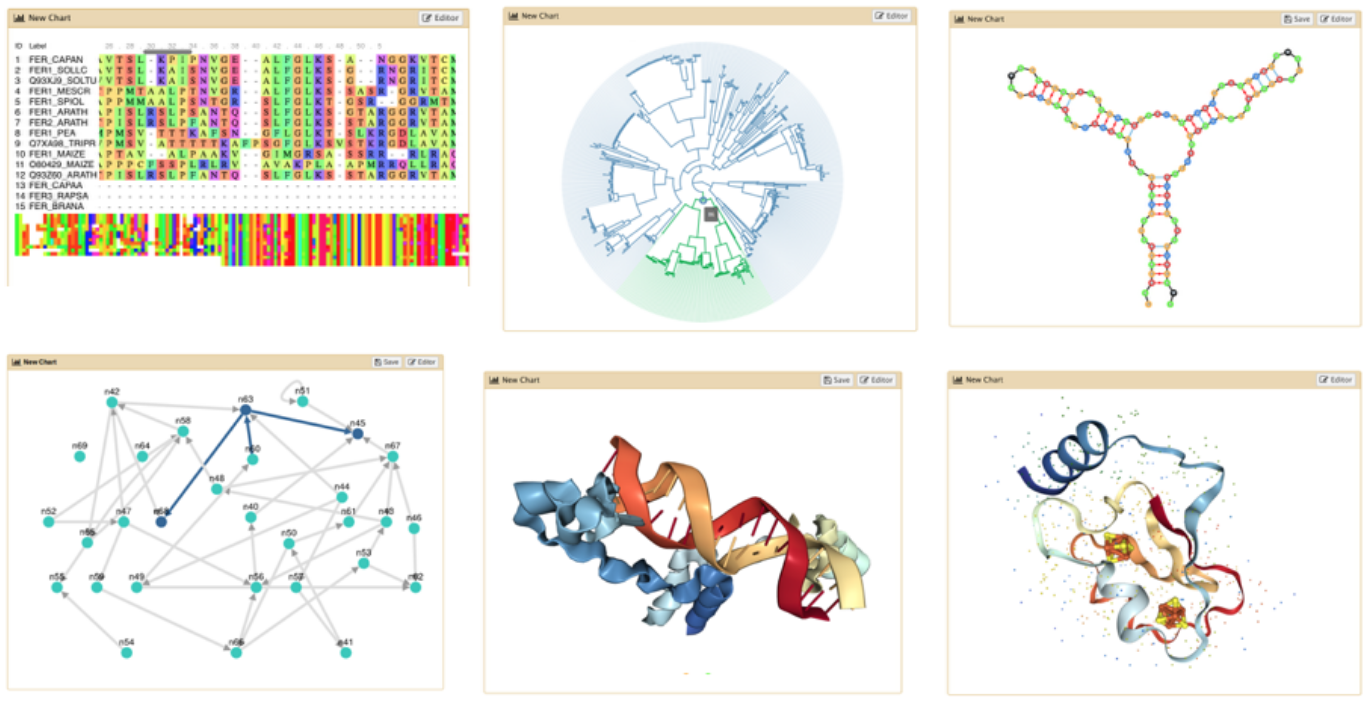
- Example: Protein Viewer
Go Up
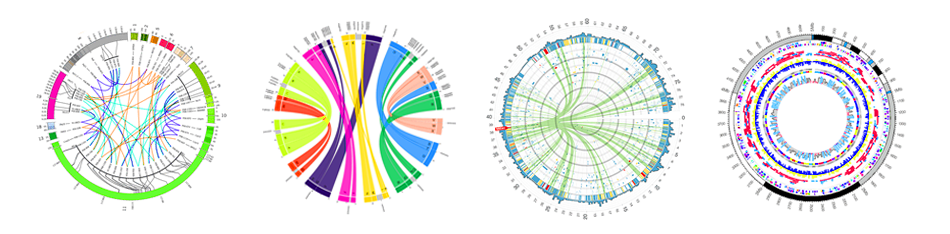
- Many tools for visualisation
- Example: Circos for circular data plots
Go Up