Users learn how to annotate somatic mutations and understand the significance of functional annotations. It also covers using different variant annotators.
Following the variant calling process, where somatic mutations are identified, it is essential
to annotate these variants with functional information
to gain a deeper understanding of their potential impact on the genome
Starting from the VCF file generated during the Detection step or provided by the user, Musta performs accurate and confident annotation by leveraging the power of two annotation tools:
These annotation tools provide comprehensive information about the functional consequences of each variant, helping researchers understand the biological implications of the detected somatic mutations.
The command structure for invoking the Classification module in Musta is as follows:
musta classify [options]
By default, Musta uses VEP for variant annotation, but users can also choose to use Funcotator or a combination of both.
Here is a breakdown of the available options for the musta classify command:
General Options:
-h, --help: Show the help message and exit.Required Options:
--workdir PATH (-w PATH): Specifies the destination folder for analysis. This is where the Snakemake pipeline, logs, and analysis outputs will be located.--samples-file PATH (-s PATH): Points to a YAML file listing the datasets you wish to analyze. This file provides information about the samples to be processed. For further details, please refer to the dedicate section.--reference-file PATH (-r PATH): Identifies the path to the reference FASTA file, which is essential for the analysis. For further details, please refer to the dedicate section.--data-source PATH (-ds PATH): Specifies the path to a data source folder for Variant Annotations. To download data sources for VEP and Funcotator and organize the folders correctly, please refer to the dedicate sectionOptional Options:
--ref-version {hg19, hg38} or -rf {hg19, hg38}: Specifies the version of the Human Genome reference to use (e.g., hg19 or hg38). By default, this option is set to hg19--cache-version CACHE_VERSION or -cv CACHE_VERSION: Specifies the version of the offline cache to use with VEP (e.g., 75, 91, 102, 105, 106). Specifies the version of the offline cache to use with VEP. By default, this option is set to 106--tmpdir PATH or -t PATH: Specifies the path to the temporary directory. Ensure that this directory has sufficient storage capacity to hold the intermediate files generated during the analysis.Variant Annotator Filtering Options:
--also-funcotator or -af: Runs GATK Funcotator in addition to VEP.--only-funcotator or -of: Runs GATK Funcotator exclusively without VEP.Additional Options:
--force, -f: Forces the re-creation of all output files.--dryrun, -d: Describes the workflow but does not execute it. This is useful for previewing the analysis steps before running them.--summary-only, -so: Generate summary reports without re-running the analysis.Obtain the “test-data-somatic” Dataset: First, download the “test-data-somatic” dataset by following the instructions provided in the dedicated section of this user guide.
Create an Input Samples YAML File:
Prepare an input samples.yml file, specifying your sample names, normal and tumor sample information, and paths to the corresponding BAM and VCF files. Here’s an example YAML structure:
sample_A25:
    normal_sample_name:
        - N1
    tumor_sample_name:
        - A25
    normal_bam:
        - /path/to/test-data-somatic/data/bam/N1.chr22.bam
    tumor_bam:
        - /path/to/test-data-somatic/data/bam/A25.chr22.bam
    vcf:
        - /path/to/test-data-somatic/data/vcf/sample_A25.musta.snvs.vcf.gz

sample_B33:
    normal_sample_name:
        - N1
    tumor_sample_name:
        - B33
    normal_bam:
        - /path/to/test-data-somatic/data/bam/N1.chr22.bam
    tumor_bam:
        - /path/to/test-data-somatic/data/bam/B33.chr22.bam
    vcf:
        - /path/to/test-data-somatic/data/vcf/sample_B33.musta.snvs.vcf.gz

sample_C2:
    normal_sample_name:
        - N1
    tumor_sample_name:
        - C2
    normal_bam:
        - /path/to/test-data-somatic/data/bam/N1.chr22.bam
    tumor_bam:
        - /path/to/test-data-somatic/data/bam/C2.chr22.bam
    vcf:
        - /path/to/test-data-somatic/data/vcf/sample_C2.musta.snvs.vcf.gz
Modify it according to your specific requirements.
Download Classification Sources: Due to their large size and the complexity of reducing them to a demo version specific to chromosome 22, have not been included them in the “test-data-somatic” dataset. Users are invited to independently download these resources by following the instructions provided in the dedicated section.
Run Musta Classify with both Variant Annotator Enabled: To execute the “Musta Classify” module with both variant annotators enabled, use the following command with the “test-data-somatic” dataset.
musta classify \
--workdir /path/to/workdir \
--samples-file /path/to/samples.yml \
--reference-file /path/to/test-data-somatic/resources/chr22.fa \
--data-source /path/to/data-source \
--also-funcotator
Ensure you replace the /path/to/ placeholders with the actual file paths on your system.
These steps will help you quickly initiate somatic mutation classification using the “test-data-somatic” dataset within the Musta Classify module.
After initiating the execution of musta classify, you will see the Musta log unfolding on your screen:
YYYY-MM-DD hh:mm:ss|INFO    |main |musta v1.0.0 - End-to-end pipeline to detect, classify and interpret mutations in cancer
YYYY-MM-DD hh:mm:ss|INFO    |main |Somatic Mutations Classification.
Functional annotation of called somatic variants
VEP and/or GATK Funcotator
YYYY-MM-DD hh:mm:ss|INFO    |main |Reading configuration file
YYYY-MM-DD hh:mm:ss|INFO    |main |Setting paths
YYYY-MM-DD hh:mm:ss|INFO    |main |Deploying musta:v1.2.0.1 pipeline from https://github.com/solida-core/musta.git
YYYY-MM-DD hh:mm:ss|INFO    |main |Initializing  Config file
YYYY-MM-DD hh:mm:ss|INFO    |main |Initializing  Samples file
YYYY-MM-DD hh:mm:ss|INFO    |main |Running
YYYY-MM-DD hh:mm:ss|INFO    |main |Variant Annotation
YYYY-MM-DD hh:mm:ss|INFO    |main |Variant Annotator:  'vep'
Building DAG of jobs...
After a few minutes, you will see the last lines of the log, and the execution of Musta will conclude. You can locate the resulting analysis in the following destination folders:
These folders will contain the relevant data and reports generated during the musta classify execution.
Let’s take a look at the <WORKDIR> folder
.
├── benchmarks
│   ├── ...
│   └── classification
├── logs
│   ├── ...
│   └── classification
├── musta
│   ├── config
│   ├── LICENSE
│   ├── README.md
│   ├── resources
│   └── workflow
└── outputs
    ├── YYYYMMDD-hhmmss.report.html
    ├── ...
    └── classification
    ─ benchmarks
  │   ├── ...
  │   └── classification
  │       ├── vep
  │       │   ├── sample_A25.vep.txt
  │       │   ├── sample_B33.vep.txt
  │       │   ├── sample_C2.vep.txt
  │       │   ├── sample_A25.vep2maf.txt
  │       │   ├── sample_B33.vep2maf.txt
  │       │   └── sample_C2.vep2maf.txt
  │       └── funcotator
  │       │   ├── sample_A25.funcotator.vcf.txt
  │       │   ├── sample_B33.funcotator.vcf.txt
  │       │   ├── sample_C2.funcotator.vcf.txt
  │       │   ├── sample_A25.funcotator.vcf2maf.txt
  │       │   ├── sample_B33.funcotator.vcf2maf.txt
  │       │   └── sample_C2.funcotator.vcf2maf.txt
classification: In this subdirectory, you’ll find log files related to the classification module. These logs provide detailed information about the execution of various variant annotators.
── logs
│   ├── ...
│   └── classification
│       ├── vep
│       │   ├── sample_A25.vep.log
│       │   ├── sample_B33.vep.log
│       │   ├── sample_C2.vep.log
│       │   ├── sample_A25.vep2maf.log
│       │   ├── sample_B33.vep2maf.log
│       │   └── sample_C2.vep2maf.log
│       └── funcotator
│       │   ├── sample_A25.funcotator.vcf.log
│       │   ├── sample_B33.funcotator.vcf.log
│       │   ├── sample_C2.funcotator.vcf.log
│       │   ├── sample_A25.funcotator.vcf2maf.log
│       │   ├── sample_B33.funcotator.vcf2maf.log
│       │   └── sample_C2.funcotator.vcf2maf.log
musta: The directory houses the core of the Musta tool, including the Snakemake pipeline, which can be accessed from the official Musta GitHub repository: https://github.com/solida-core/musta.
YYMMDD-hhmmss.report.html: Auto-generated, independent, detailed HTML reports that include runtime statistics, provenance information, workflow topology, and results.classification: The directory houses the outcomes and data derived from the execution of Musta’s classification module. Within this directory, users can explore a wealth of output files and data that are byproducts of the analysis. Specifically, you can find:
.
├── vep
├── funcotator
├── results
│   ├── sample_A25.annotated.vep.vcf.gz
│   ├── sample_A25.annotated.vep.vcf.gz.tbi
│   ├── sample_A25.annotated.vep.maf
│   ├── sample_A25.annotated.funcotator.vcf.gz
│   ├── sample_A25.annotated.funcotator.vcf.gz.tbi
│   ├── sample_A25.annotated.funcotator.maf
│   ├── sample_B33....
│   └── sample_C2....
Within the results directory,
a dedicated summary folder has been organized to compile and present essential aggregated data.
This structured collection aids users in comprehending and interpreting key metrics and visual representations.
Below is a detailed list of the files available in the summary folder:
└── summary
    ├── gene_summary_all.tsv
    ├── gene_summary_pass.tsv
    ├── impact_summary_all.tsv
    ├── impact_summary_pass.tsv
    ├── mean_runtime_plot.png
    ├── mean_runtime.png
    ├── runtime_for_sample_and_variant_annotator.png
    ├── somatic_variants_for_sample_and_variant_annotator.png
    └── summary_for_each_sample_and_variant_anotator.tsv
gene_summary_all.tsv: Comprehensive summary of gene-related metrics for all variants.
gene_summary_pass.tsv: Summary specifically focused on gene-related metrics for variants that passed the filtering criteria.
impact_summary_all.tsv: Overview of impact-related metrics for all variants.
impact_summary_pass.tsv: Summary highlighting impact-related metrics for variants that successfully passed the filtering criteria.
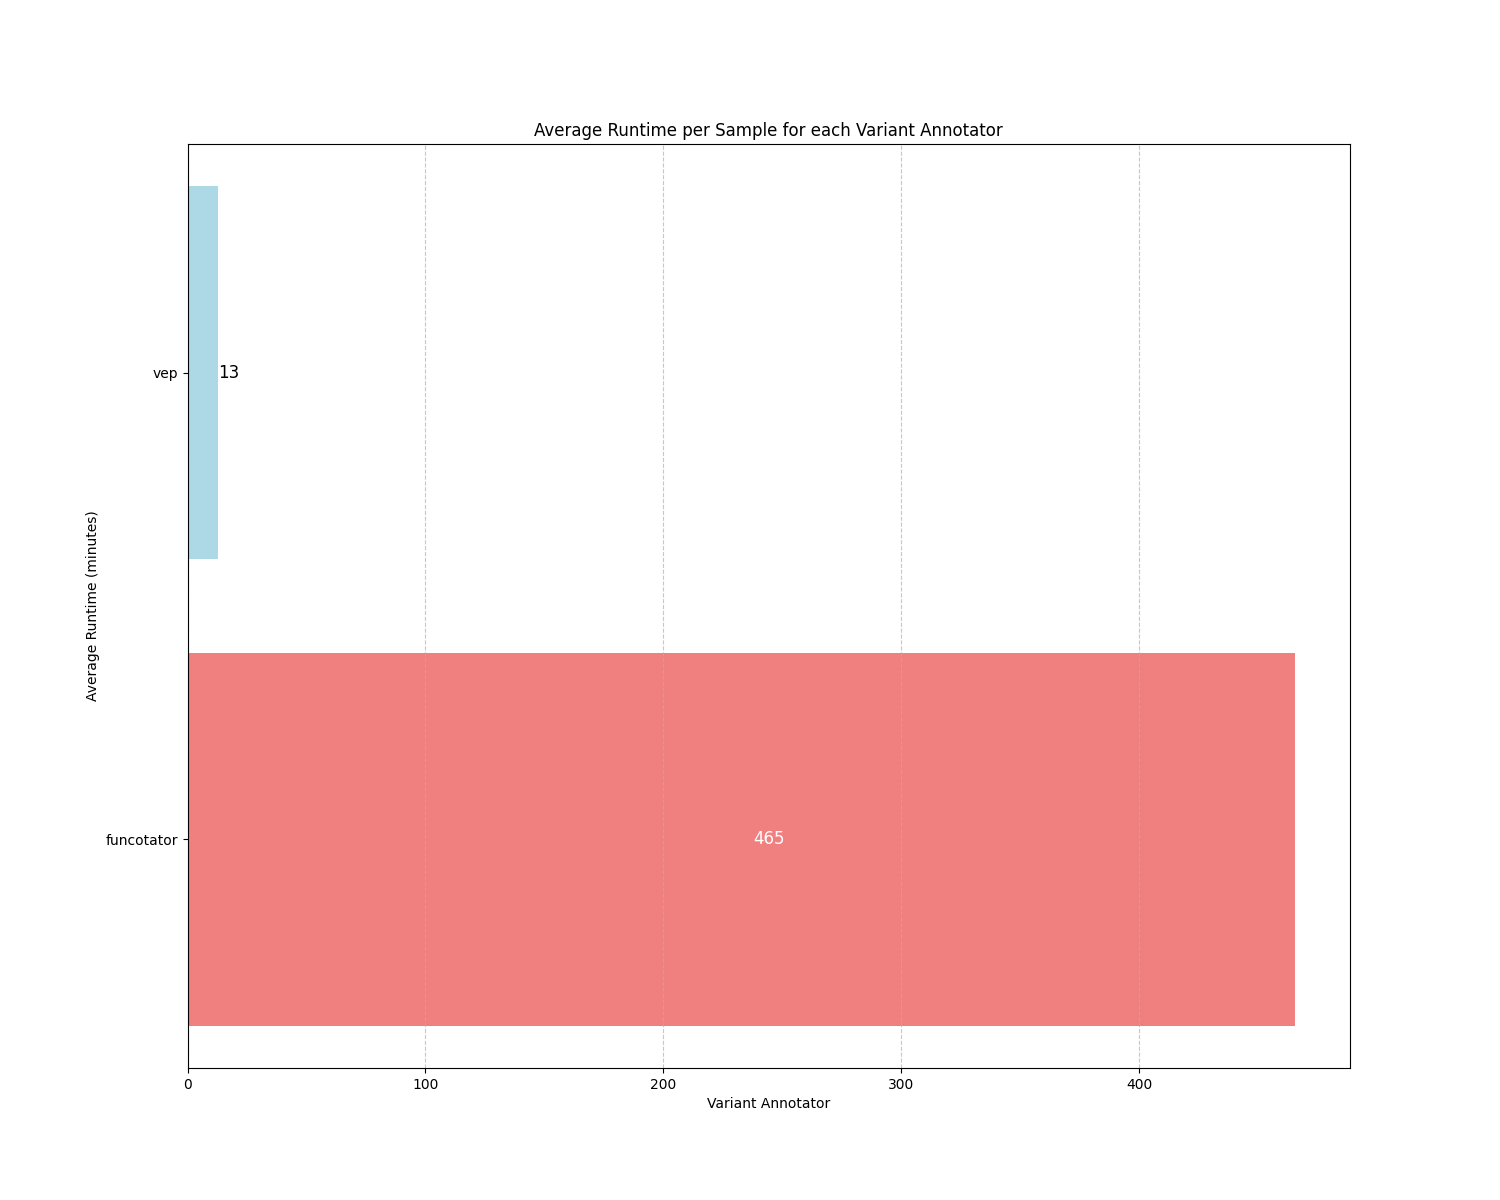
mean_runtime_plot.png: Visual representation depicting the mean runtime for each variant annotator.
mean_runtime.png: Concise graphical representation illustrating the mean runtime across all variant annotator.
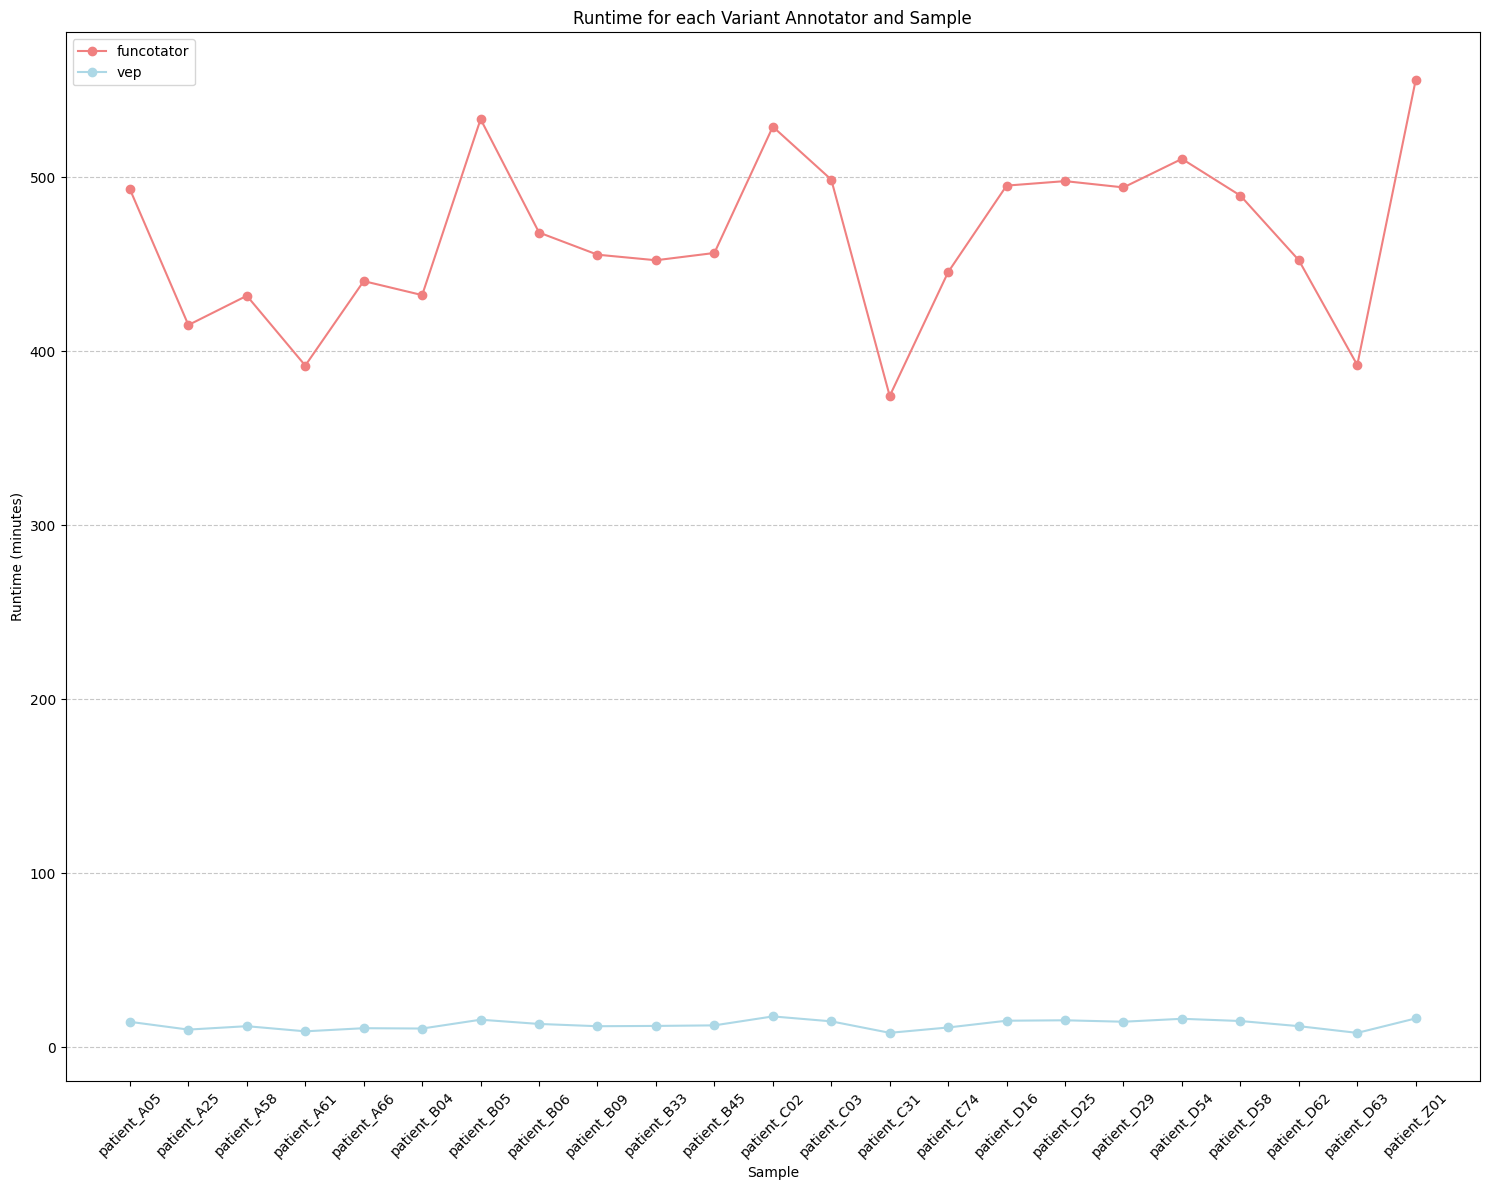
runtime_for_sample_and_variant_annotator.png: Graphical depiction of runtime distribution for each sample and variant annotator.
somatic_variants_for_sample_and_variant_annotator.png: Visual representation showcasing the count of somatic variants for each sample and variant annotator.
summary_for_each_sample_and_variant_annotator.tsv: Detailed summary encompassing key metrics for each sample and variant annotator.
These files collectively offer a comprehensive view of the analysis results, facilitating a more informed and efficient exploration of the data.
Explore different scenarios for running Musta with various configurations using the musta classify command.
1. Run Musta with Only VEP as Variant Annotator:
Run Musta using VEP to annotate somatic variants:
musta classify \
--workdir /path/to/workdir \
--samples-file /path/to/samples.yml \
--reference-file /path/to/reference.fa \
--data-source /path/to/data_source
2. Run Musta with Funcotator as Variant Annotator:
Run Musta using GATK Funcotator to annotate somatic variants:
musta classify \
--workdir /path/to/workdir \
--samples-file /path/to/samples.yml \
--reference-file /path/to/reference.fa \
--data-source /path/to/data_source \
--only-funcotator
3. Run Musta with Both VEP and Funcotator as Variant Annotators:
Run Musta using both VEP and GATK Funcotator to annotate somatic variants:
musta classify \
--workdir /path/to/workdir \
--samples-file /path/to/samples.yml \
--reference-file /path/to/reference.fa \
--data-source /path/to/data_source \
--also-funcotator
Users can customize the Human Genome reference version and the offline VEP cache version using the options:
--ref-version {hg19, hg38} and --cache-version CACHE_VERSION.
In order to discuss the results obtained from the Musta Classification module, we didn’t utilize the “test-data-somatic” dataset for this evaluation.
Instead, we conducted our analysis on the original dataset, of which the demo serves as a representative subset: 23 tumor biopsies and a tumor-adjacent matched normal sample, all sequenced at an average depth of 74.4×. (See the dedicated section)
The difference between the two variant annotation tools is their runtime efficiency. VEP completes a sample annotation in about 15 minutes, while Funcotator takes over seven hours. For these reasons, VEP is the default solution in Musta.
Given the high level of agreement and robustness observed, the choice between VEP and Funcotator ultimately depends on user preferences. Factors such as runtime requirements, computational resources, familiarity with each tool’s functionalities, and ease of access to additional files may influence the decision-making process.