Confirmation of the expected bacterial species and detection of possible contamination in isolate sequencing data.
When sequencing a genome, contamination from foreign organisms
may be inadvertently mixed with the genomic material of the species of interest.
For this reason, when working with bacterial isolates,
it is crucial to verify that the expected species or strains are present in the data
and to identify any potential contamination.
Confirming species identity and detecting contamination are essential to ensure the accuracy and reliability of the analysis, and to prevent misleading results that could affect downstream interpretations.
To illustrate the process of checking the expected species and potential contamination in a bacterial isolate,
we will use the sequencing reads filtered with fastp
in the assembly tutorial.
Before starting the analysis, prepare your Galaxy workspace as follows:
fastp by dragging and dropping them from the previous history (see here for instructions on managing and copying datasets between histories).To find out which microorganisms are present, we will compare the reads of the sample to a reference database, i.e. sequences of known microorganisms stored in a database, using Kraken2
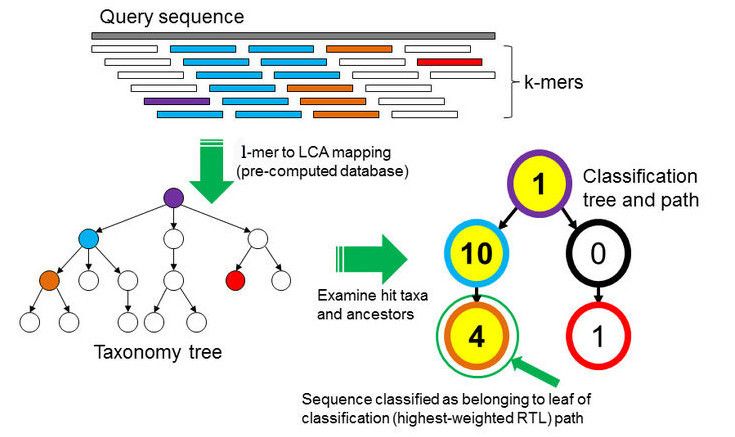
In the k-mer approach for taxonomy classification, we use a database containing DNA sequences of genomes whose taxonomy we already know. On a computer, the genome sequences are broken into short pieces of length k (called k-mers), usually 30bp.
examines the k-mers within the query sequence,
searches for them in the database,
looks for where these are placed within the taxonomy tree inside the database,
makes the classification with the most probable position,
then maps k-mers to the lowest common ancestor (LCA) of all genomes known to contain the given k-mer.
For this tutorial, we will use the PlusPF database which contains the Standard (archaea, bacteria, viral, plasmid, human, UniVec_Core), protozoa and fungi data.
Kraken2 Tool with the following parameters:
Confidence: 0.1
Minimum Base Quality: 10
A confidence score of 0.1 means that at least 10% of the k-mers should match entries in the database. This value can be reduced if a less restrictive taxonomic assignation is desired.
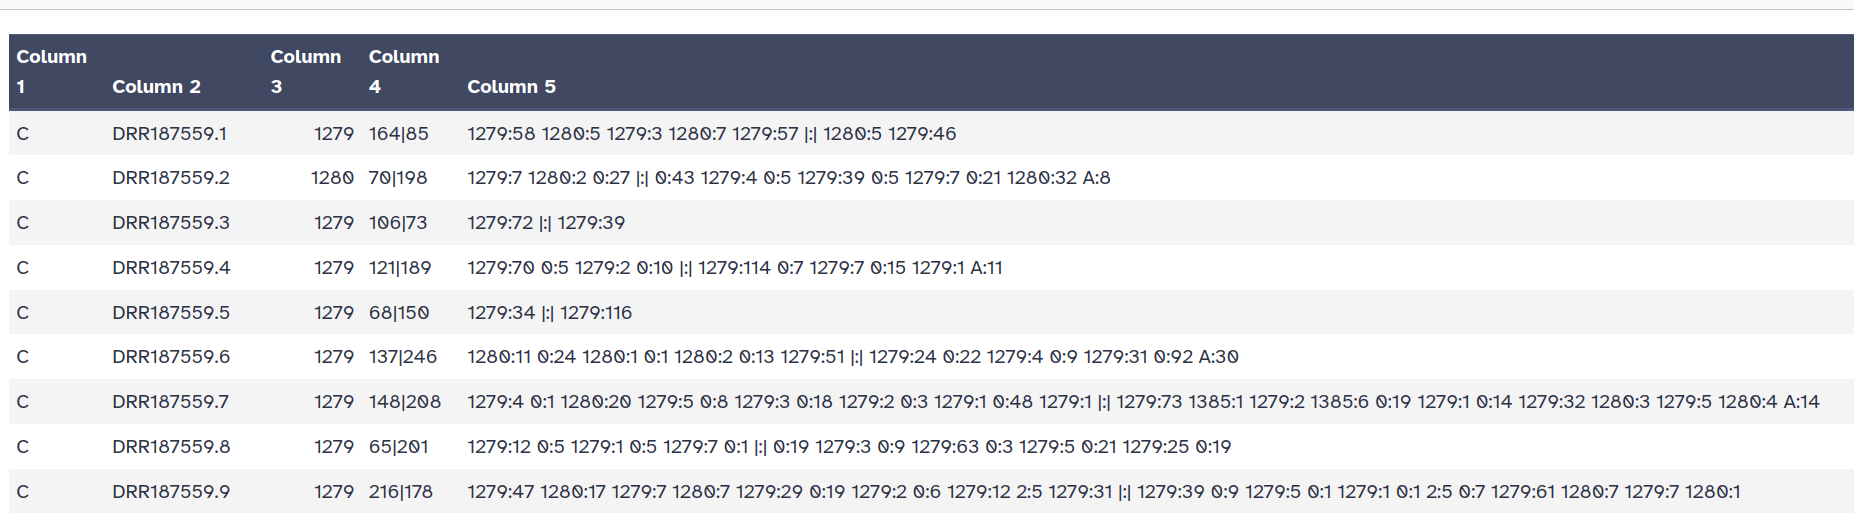
Kraken2 will create two outputs for each dataset: Classification and Report
C/U: a one letter indicating if the sequence classified or unclassifiedread1|read2 for paired reads)For example, 562:13 561:4 A:31 0:1 562:3 would indicate that:
|:| indicates end of first read, start of second read for paired reads
Question
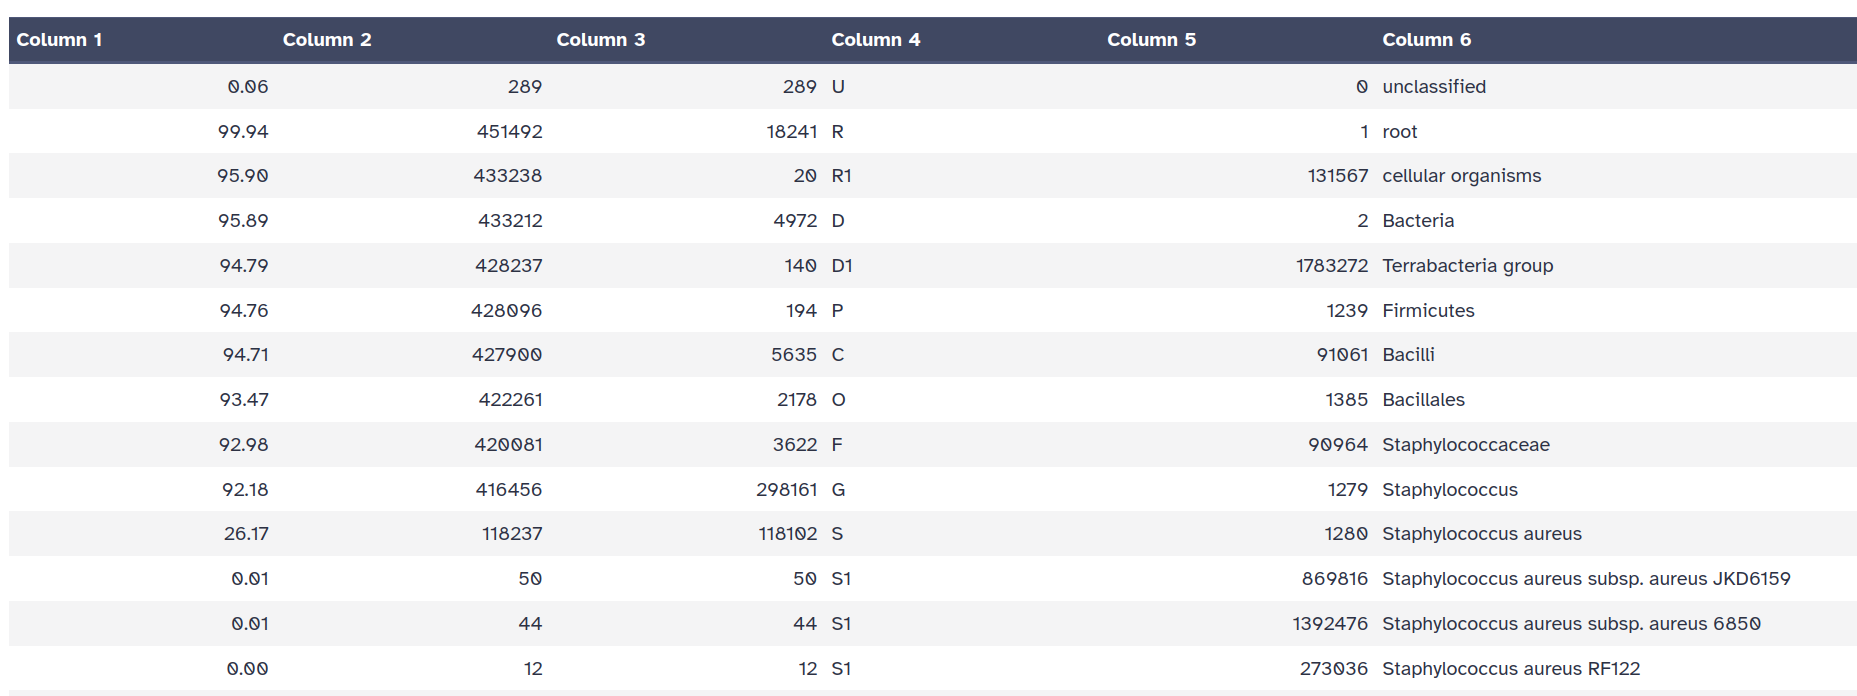
Taxa that are not at any of these 10 ranks have a rank code that is formed by using the rank code of the closest ancestor rank with a number indicating the distance from that rank.
E.g., G2 is a rank code indicating a taxon is between genus and species and the grandparent taxon is at the genus rank.
Question
In Kraken output, there are quite a lot of identified taxa with different levels. To extract the species level, we will use Bracken (Bayesian Reestimation of Abundance after Classification with Kraken).
Instead of only using proportions of classified reads, it takes a probabilistic approach to generate final abundance profiles. It works by re-distributing reads in the taxonomic tree: Reads assigned to nodes above the species level are distributed down to the species nodes, while reads assigned at the strain level are re-distributed upward to their parent species
Bracken Tool with the following parameters:
NOTE! It is important to choose the same database that you also chose for Kraken2
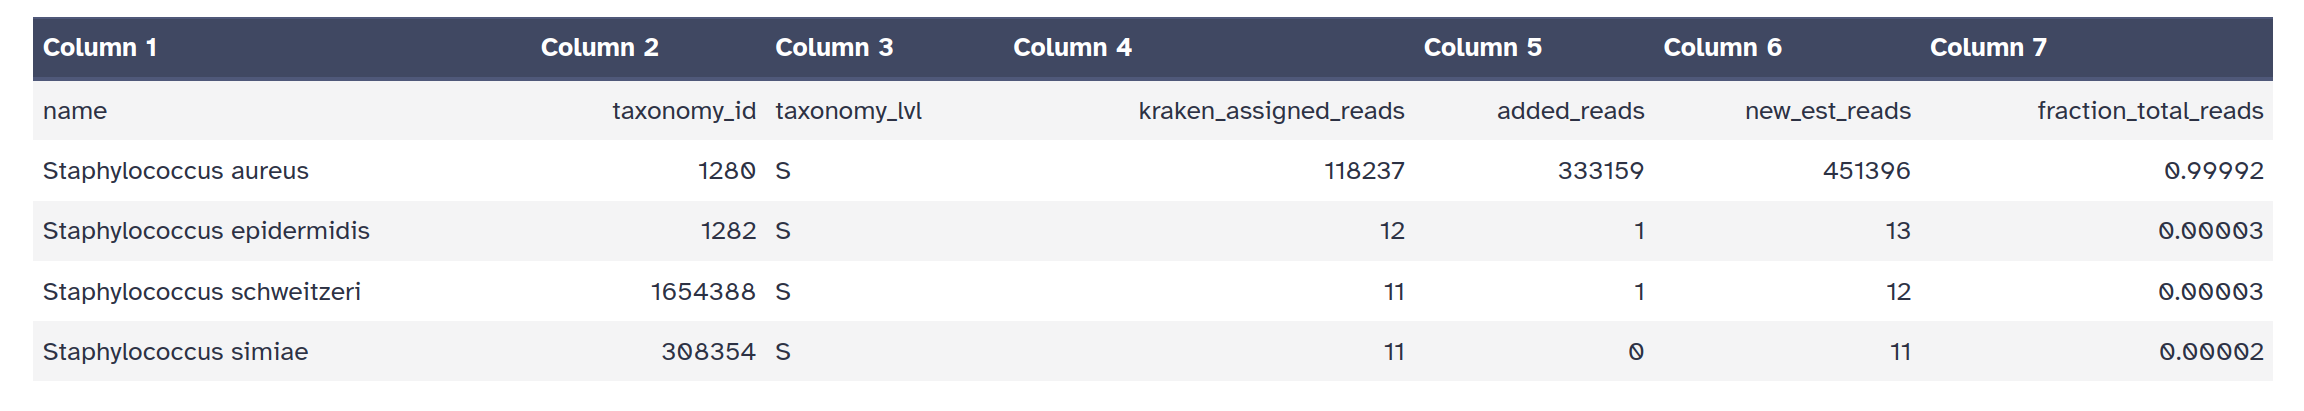
Bracken output file format (tabular):
Question
To explore Kraken report and specially to detect more reliably minority organisms or contamination,
we will use Recentrifuge
Recentrifuge with the following parameters:
In Database type:
In Output options:
In Fine tuning of algorithm parameters:
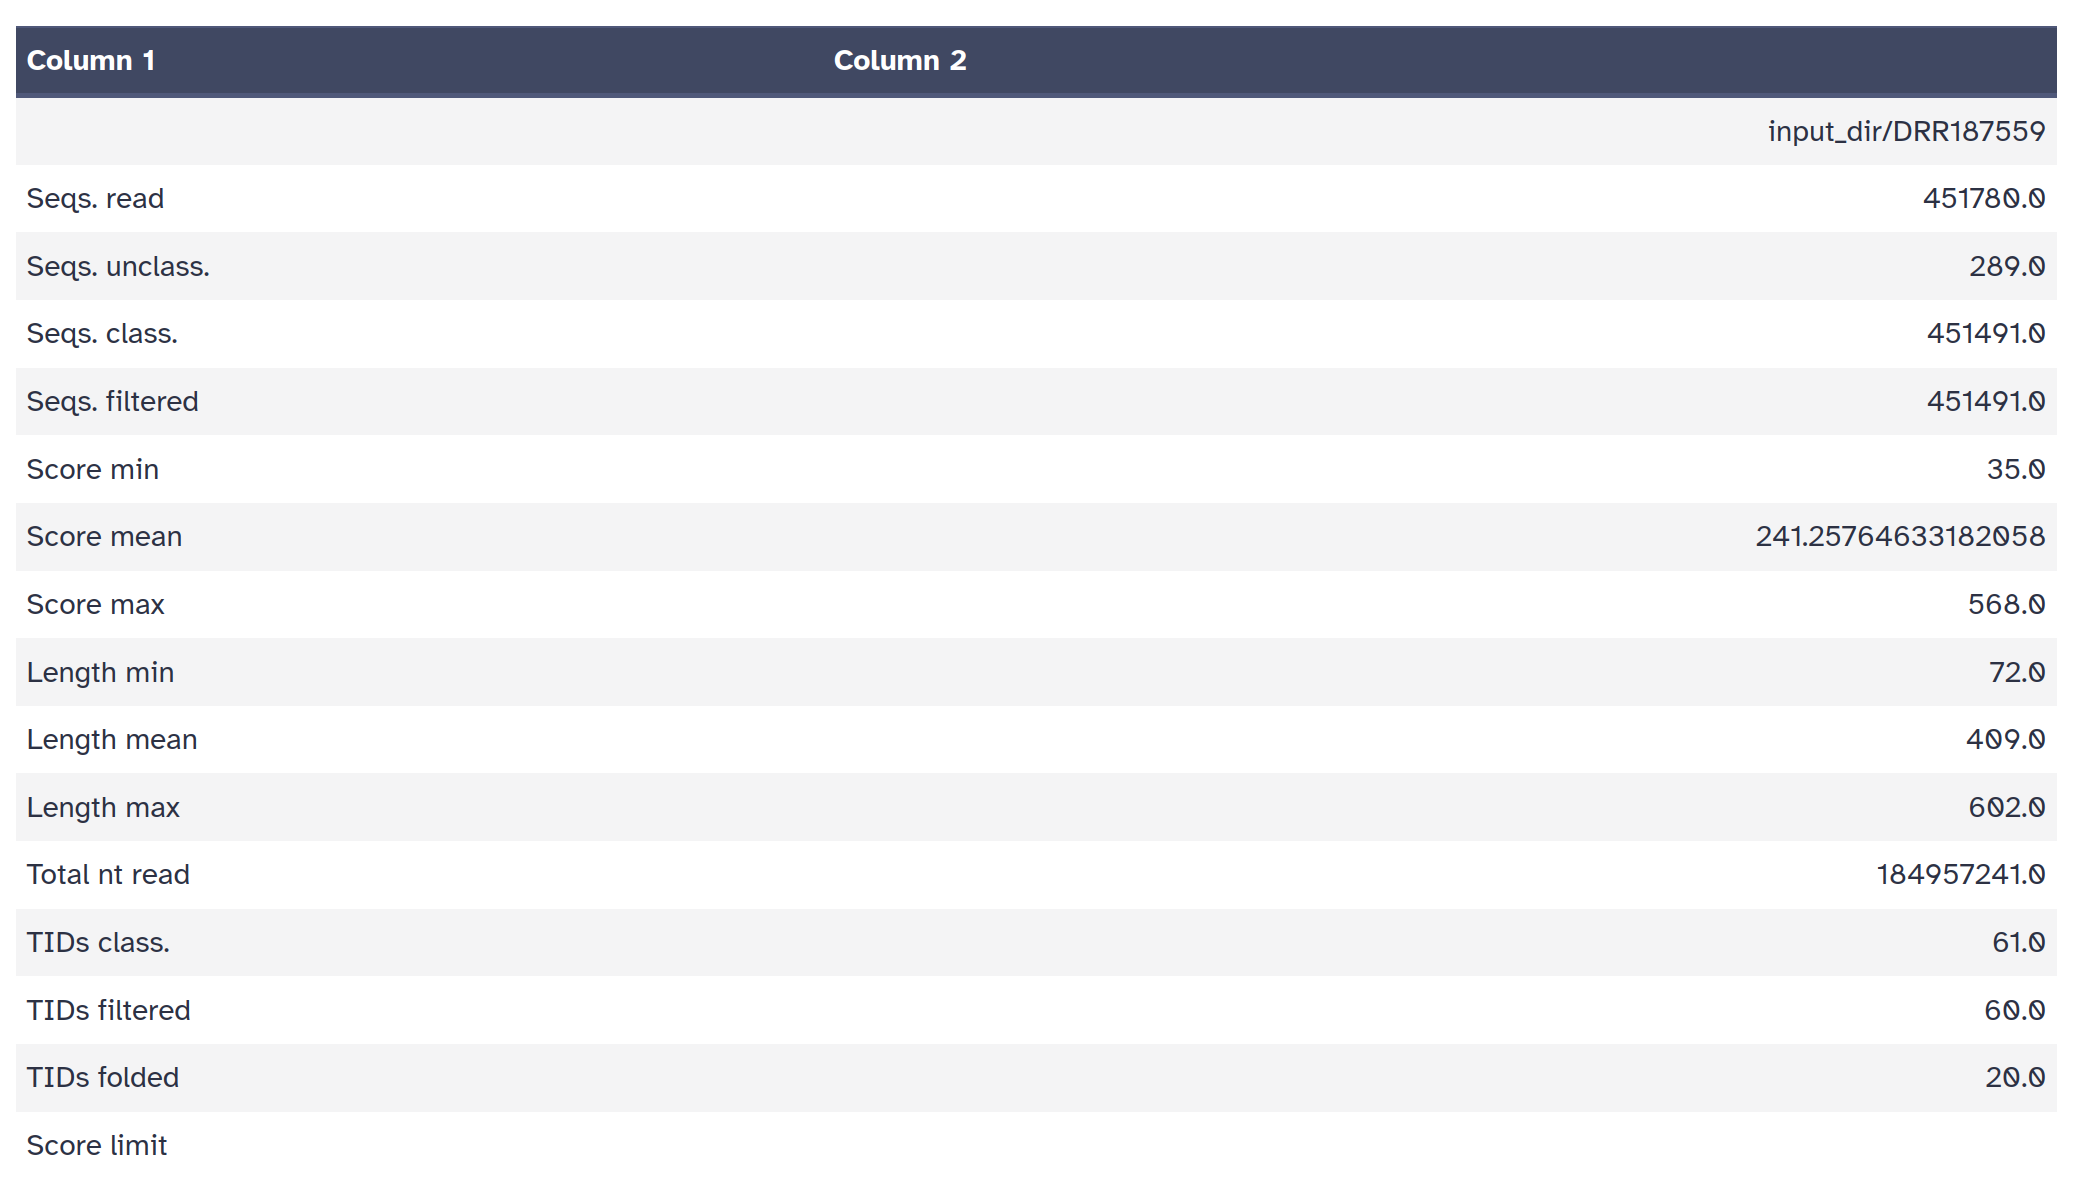
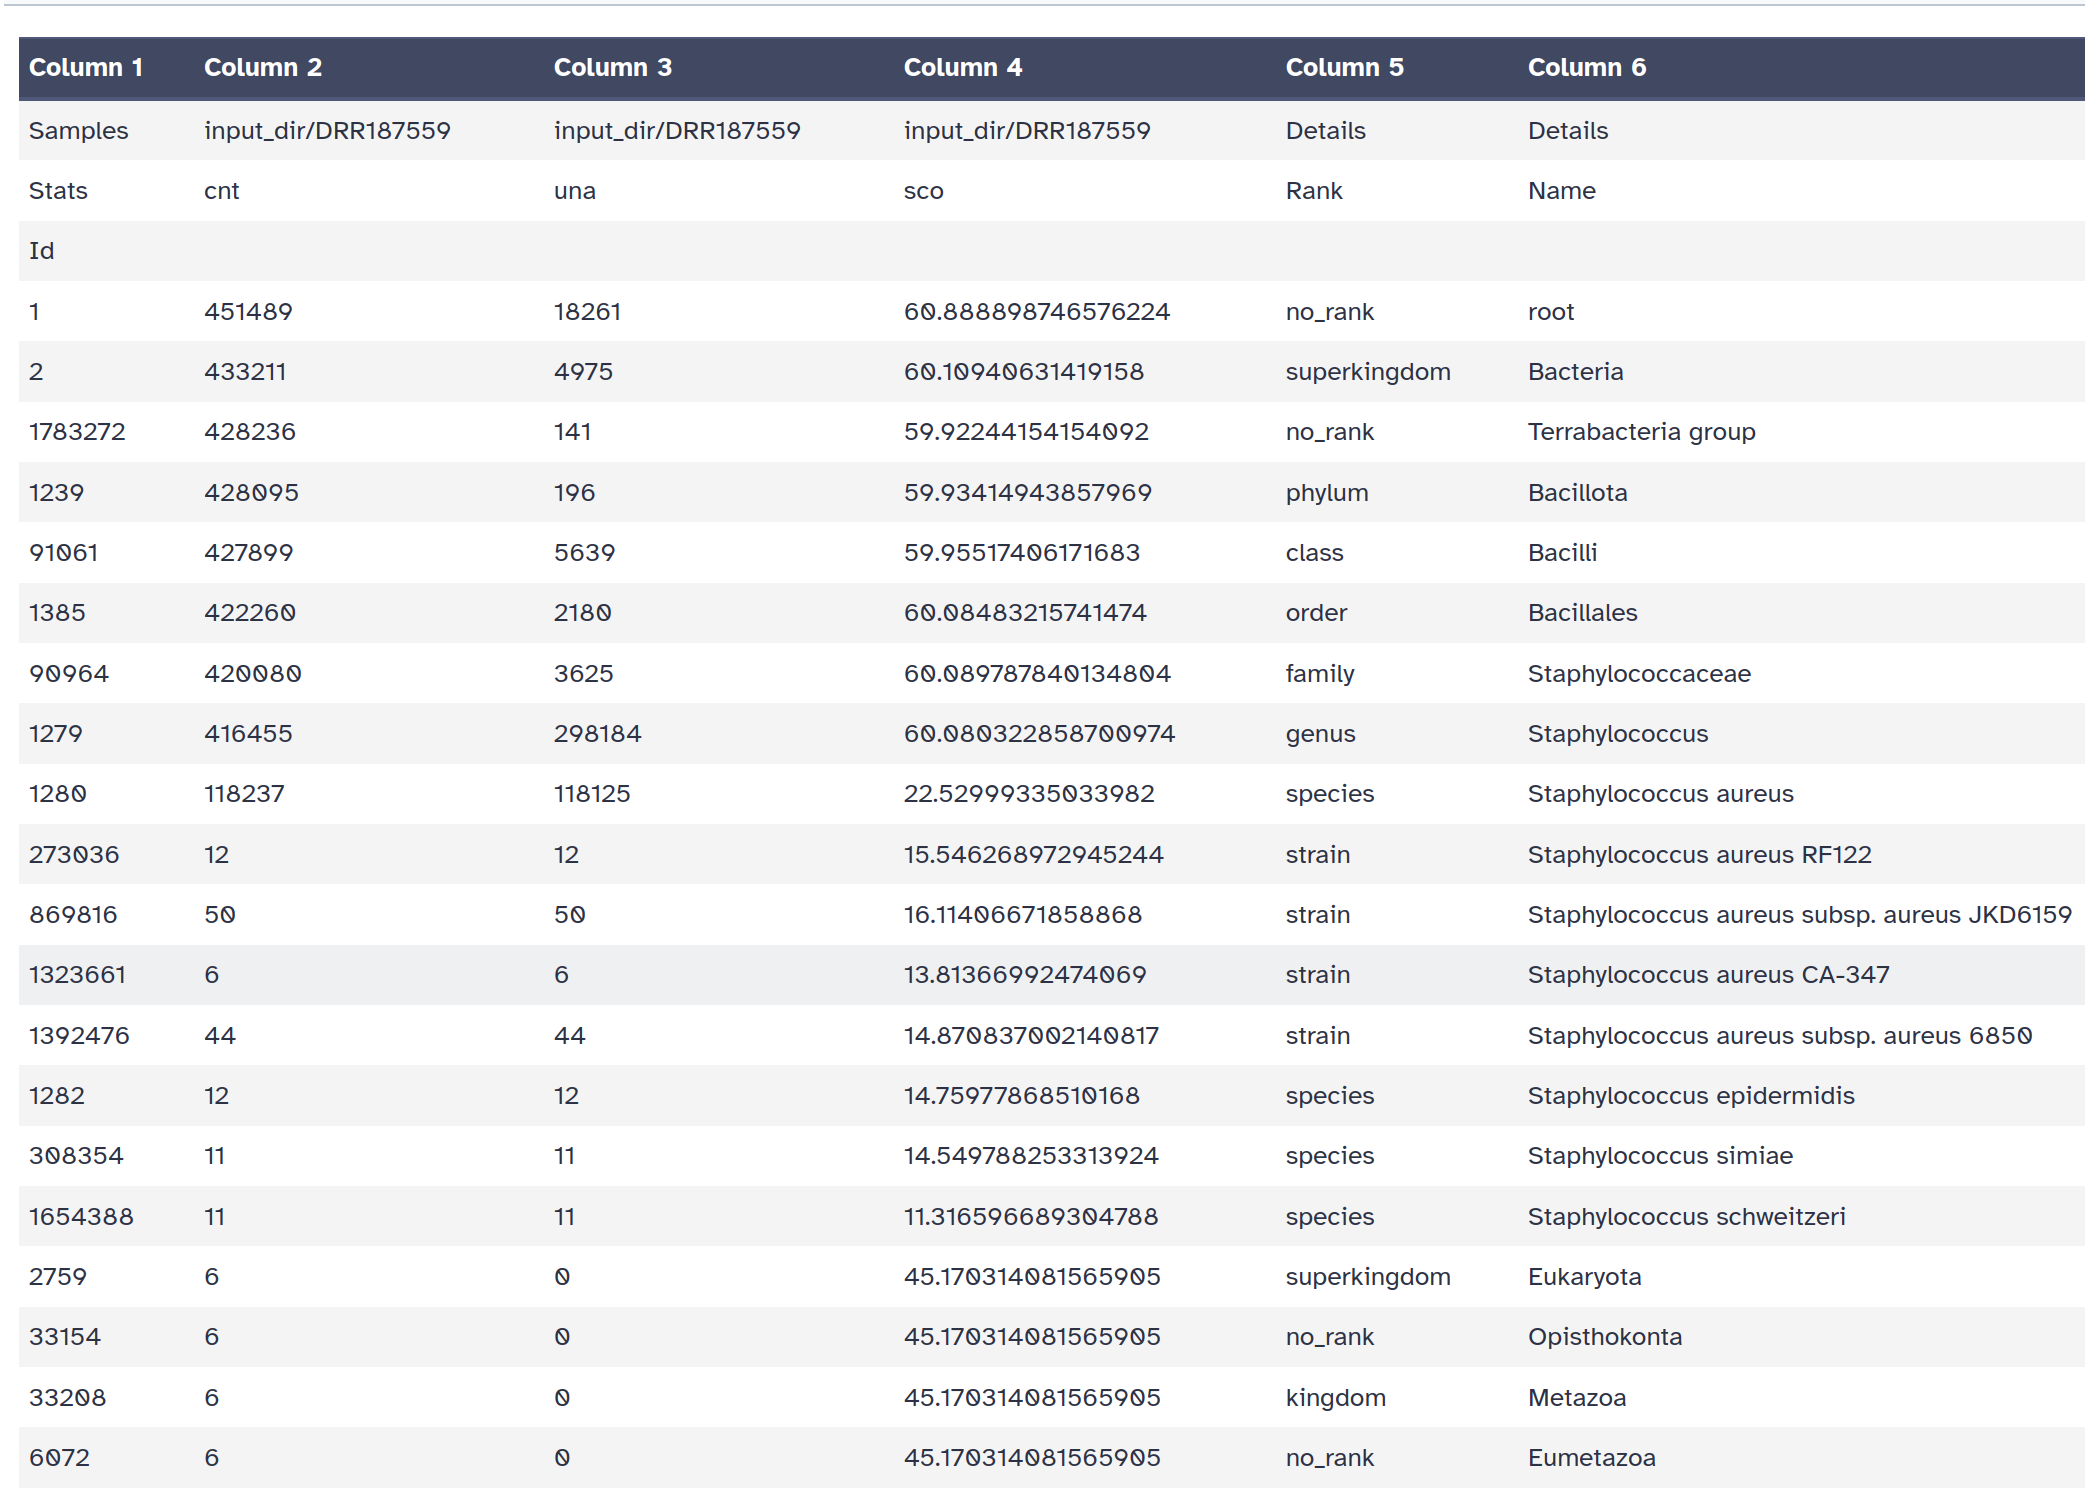
Recentrifuge generates 3 outputs:
A statistic table with general statistics about assignations
A data table with a report for each taxa
A HTML report with a Krona chart
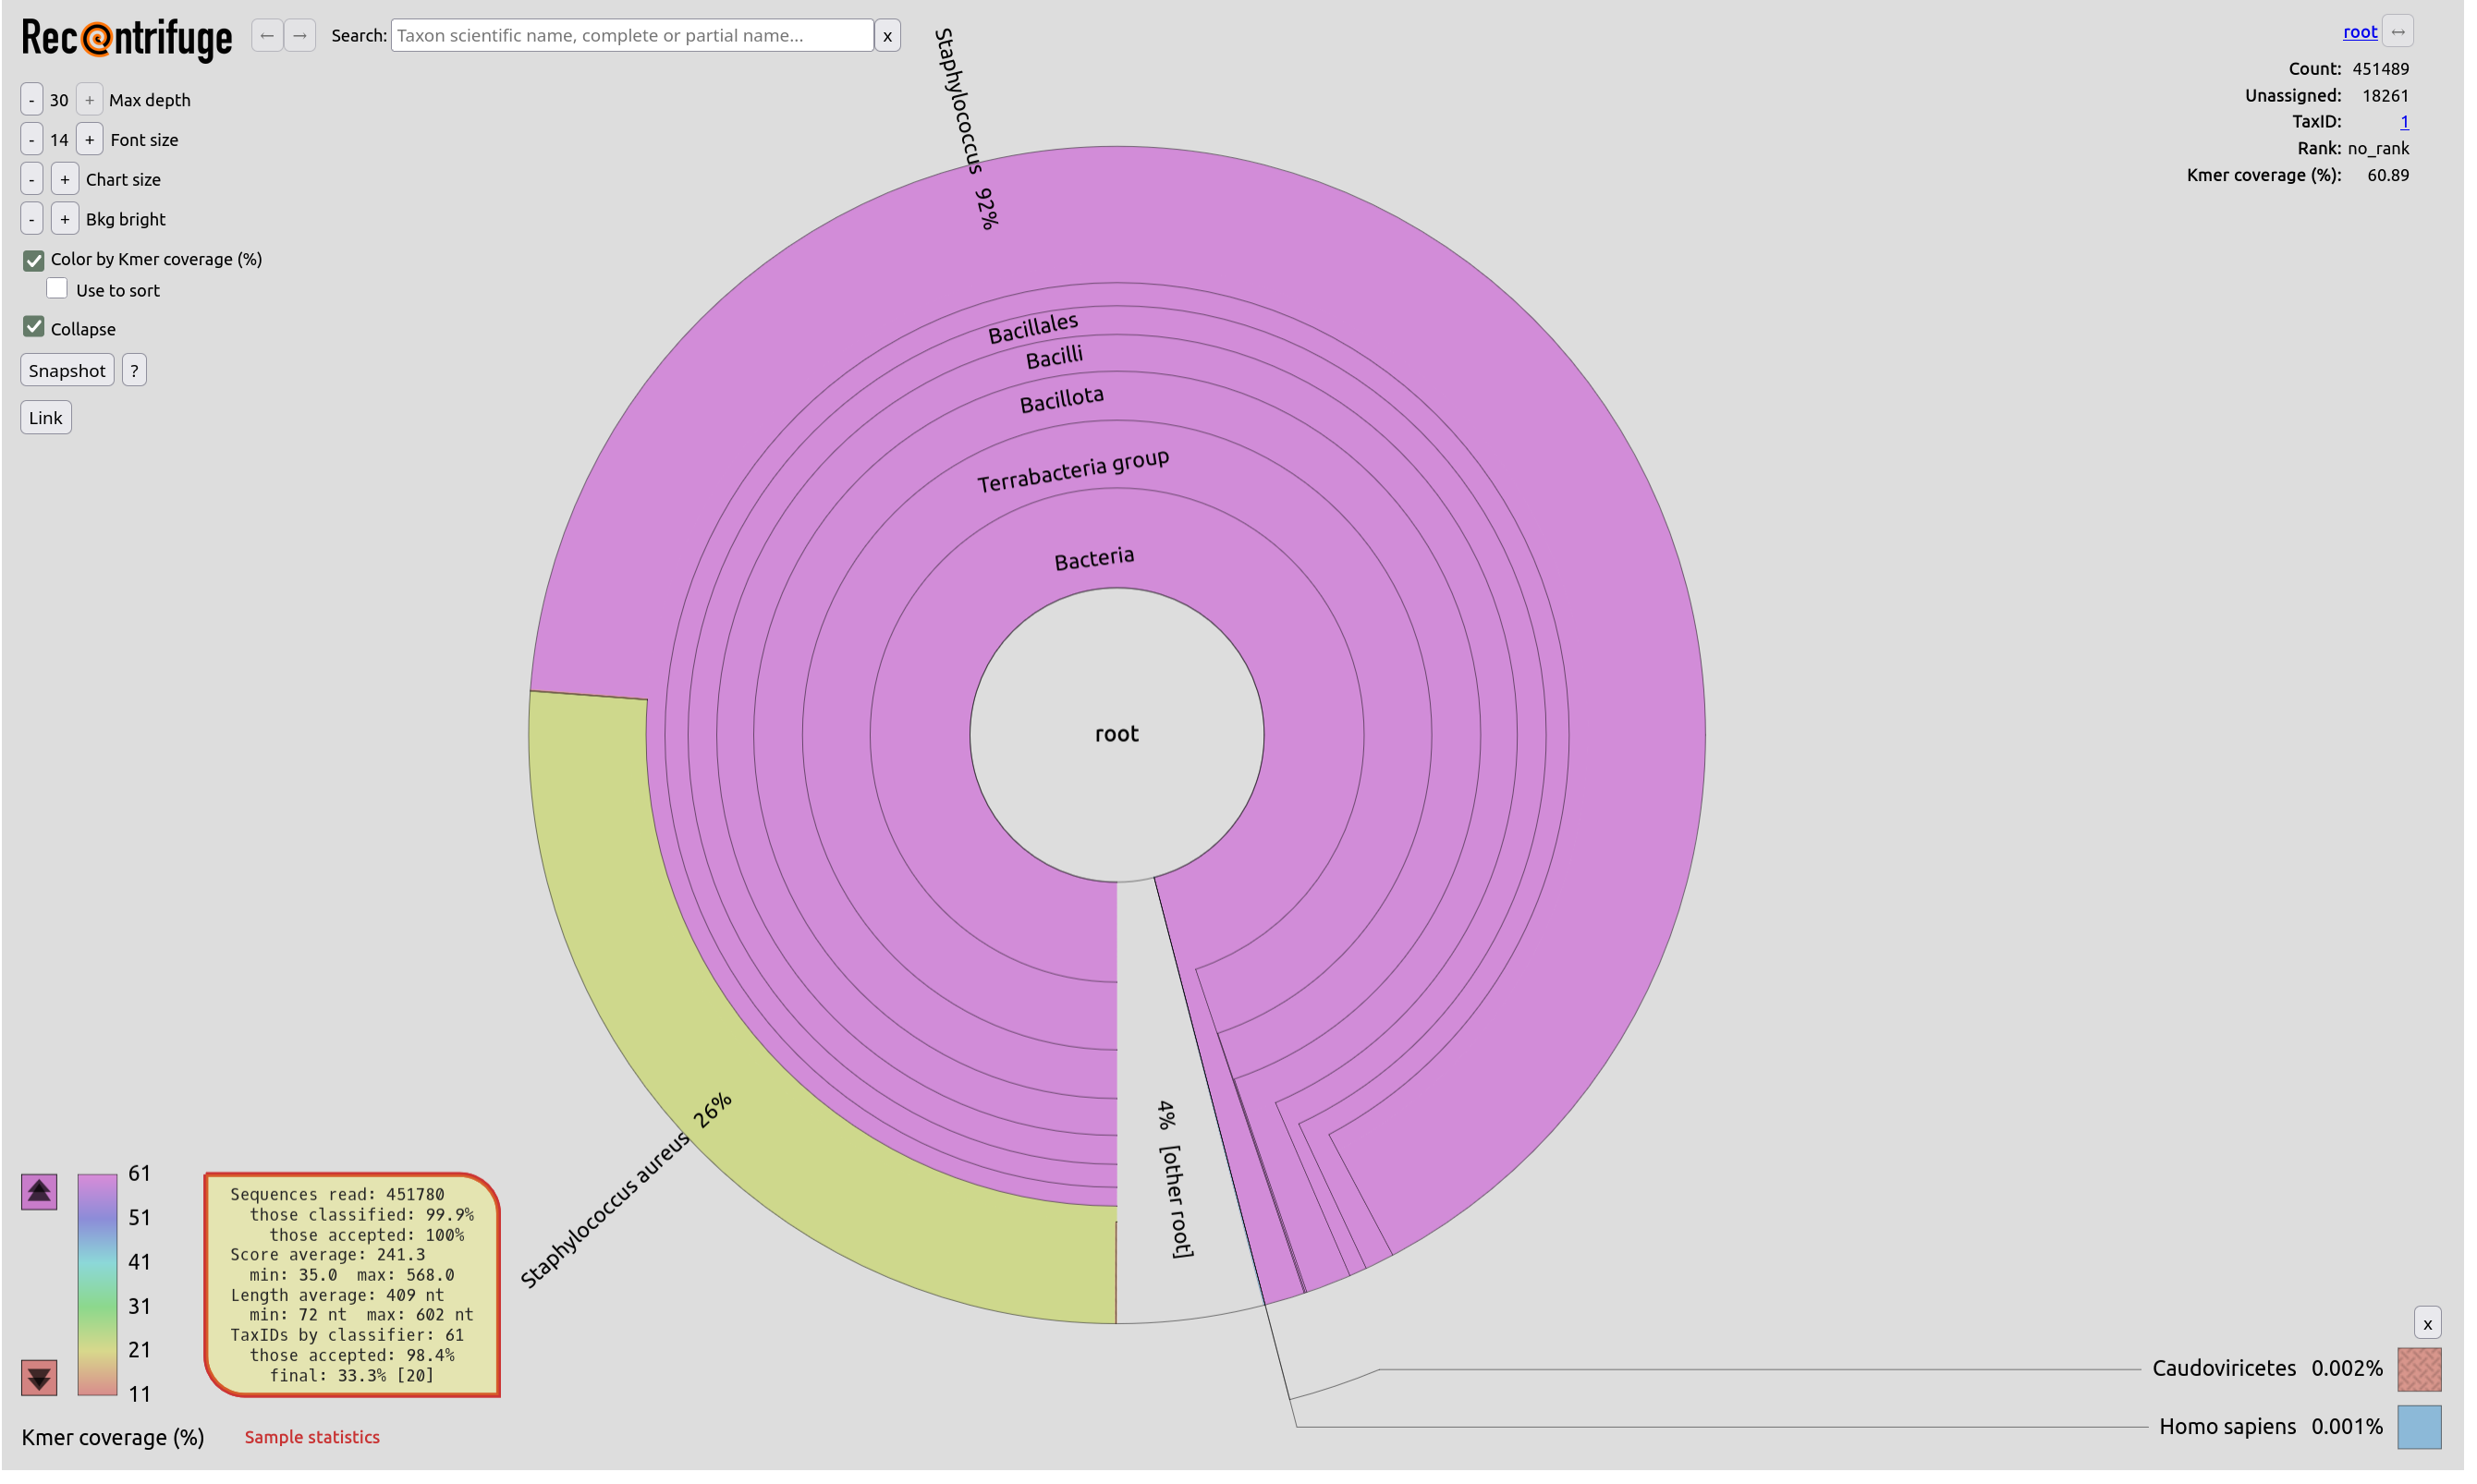
Question
NOTE! There is no sign of a possible contamination. Most sequences are classified to taxon on the Staphylococcus aureus taxonomy. Only 4% of the sequences are not classified to Staphylococcus.
Getting an overview of the assignation is not straightforward with the Kraken2 outputs directly. Once we have assigned the corresponding taxa to each sequence, the next step is to properly visualize the data. There are several tools for that:
Krona creates an interactive HTML file allowing hierarchical data to be explored with zooming,
multi-layered pie charts.
With this tool, we can easily visualize the composition of the bacterial communities and compare how the populations of microorganisms are modified according to the conditions of the environment.
Kraken outputs can not be given directly to Krona, they first need to be converted.
Krakentools is a suite of tools to work on Kraken outputs.
It include a tool designed to translate results of the Kraken metagenomic classifier
to the full representation of NCBI taxonomy.
The output of this tool can be directly visualized by the Krona tool.
Krakentools: Convert kraken report file Tool with the following parameters:
Kraken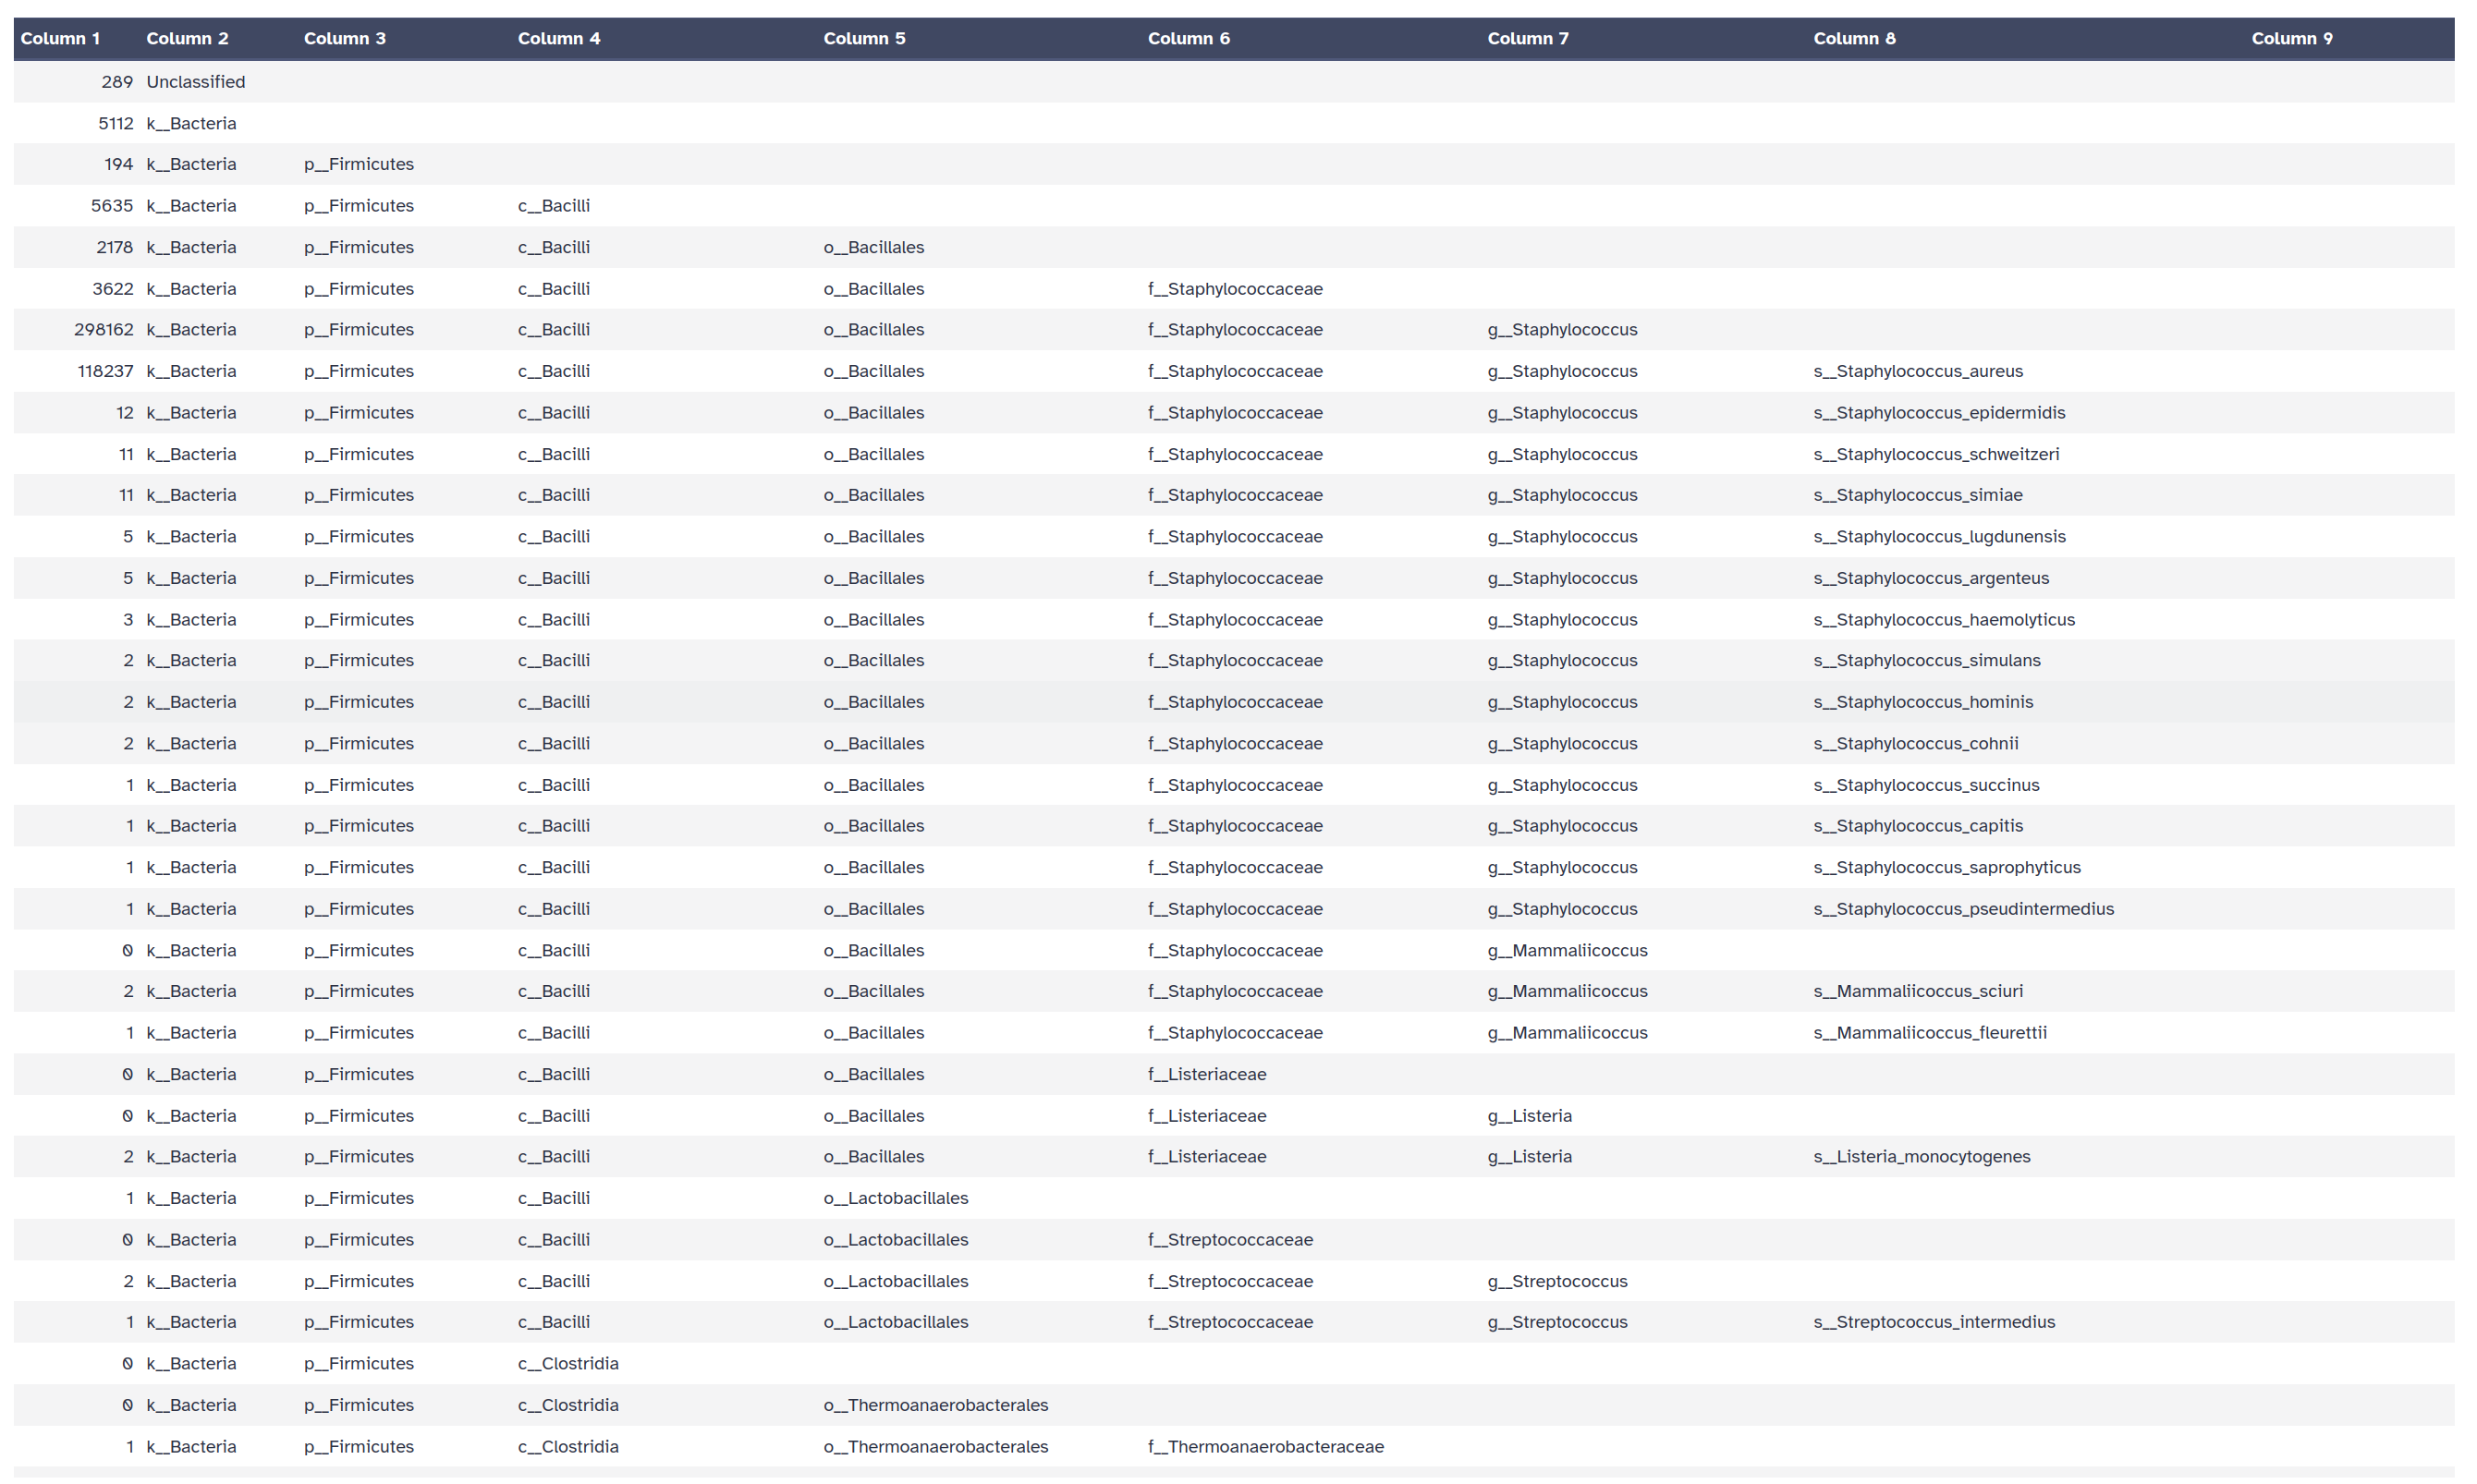
Let’s now run Krona
Krona pie chart Tool with the following parameters:
Krakentools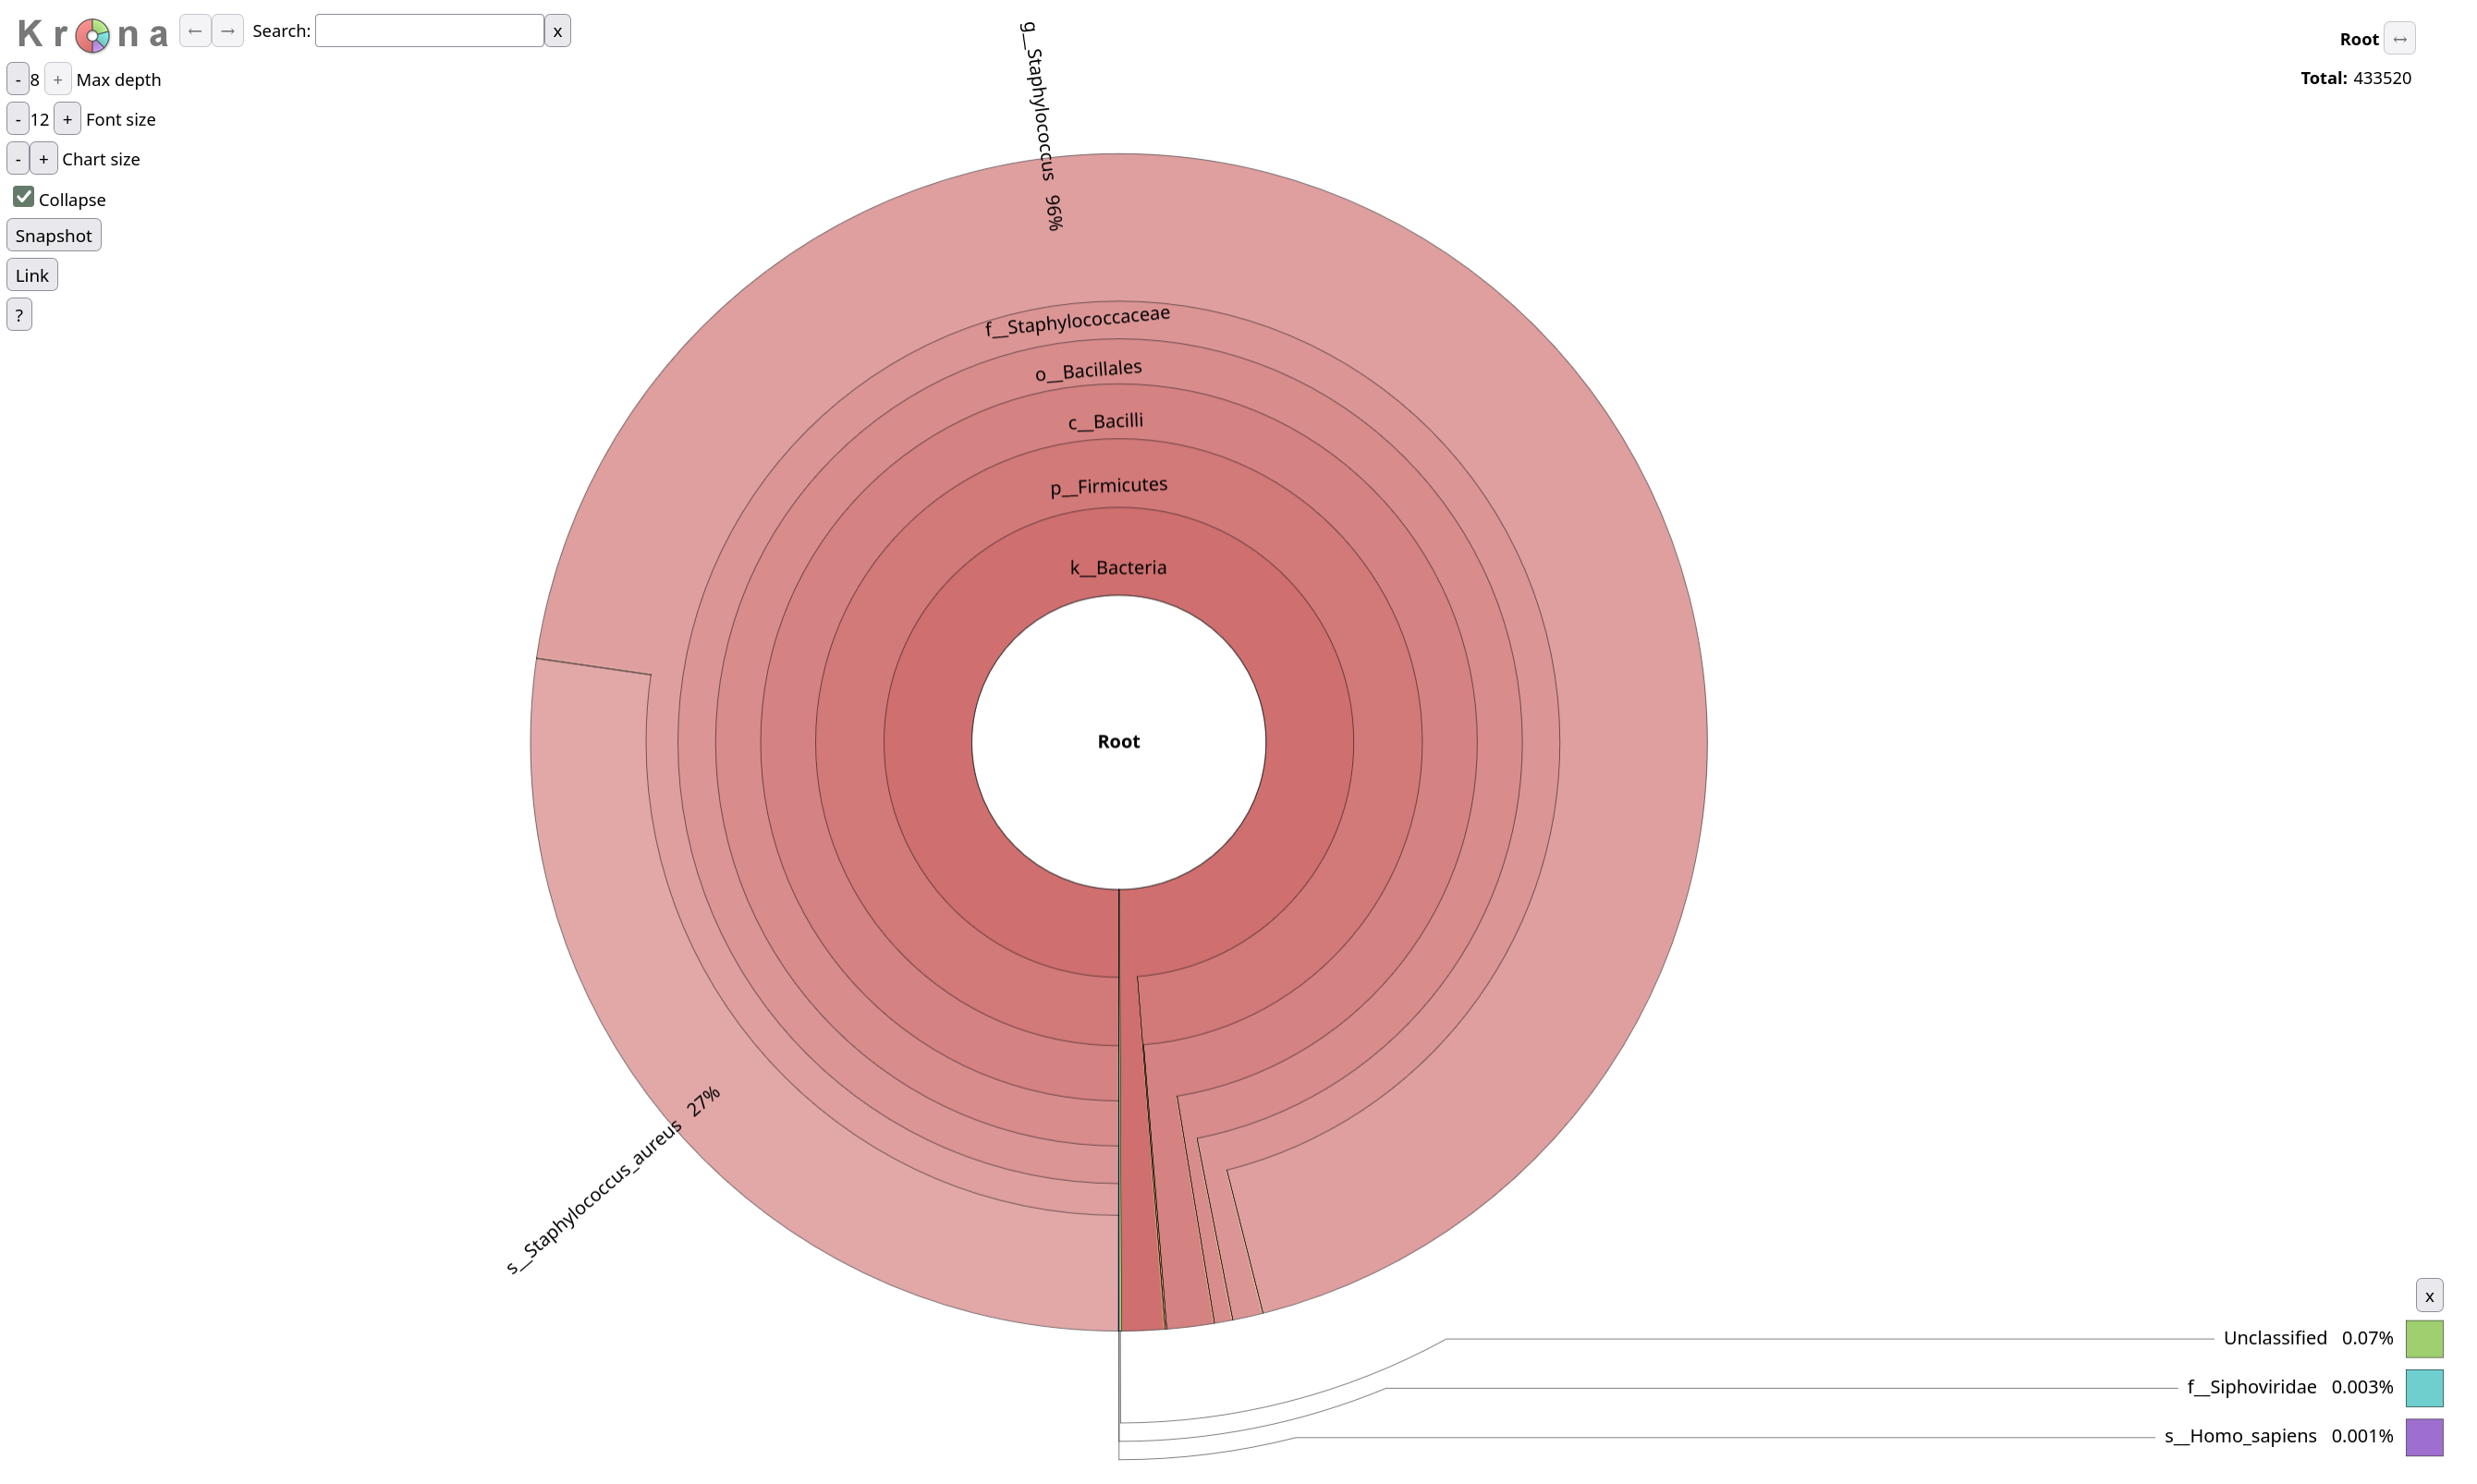
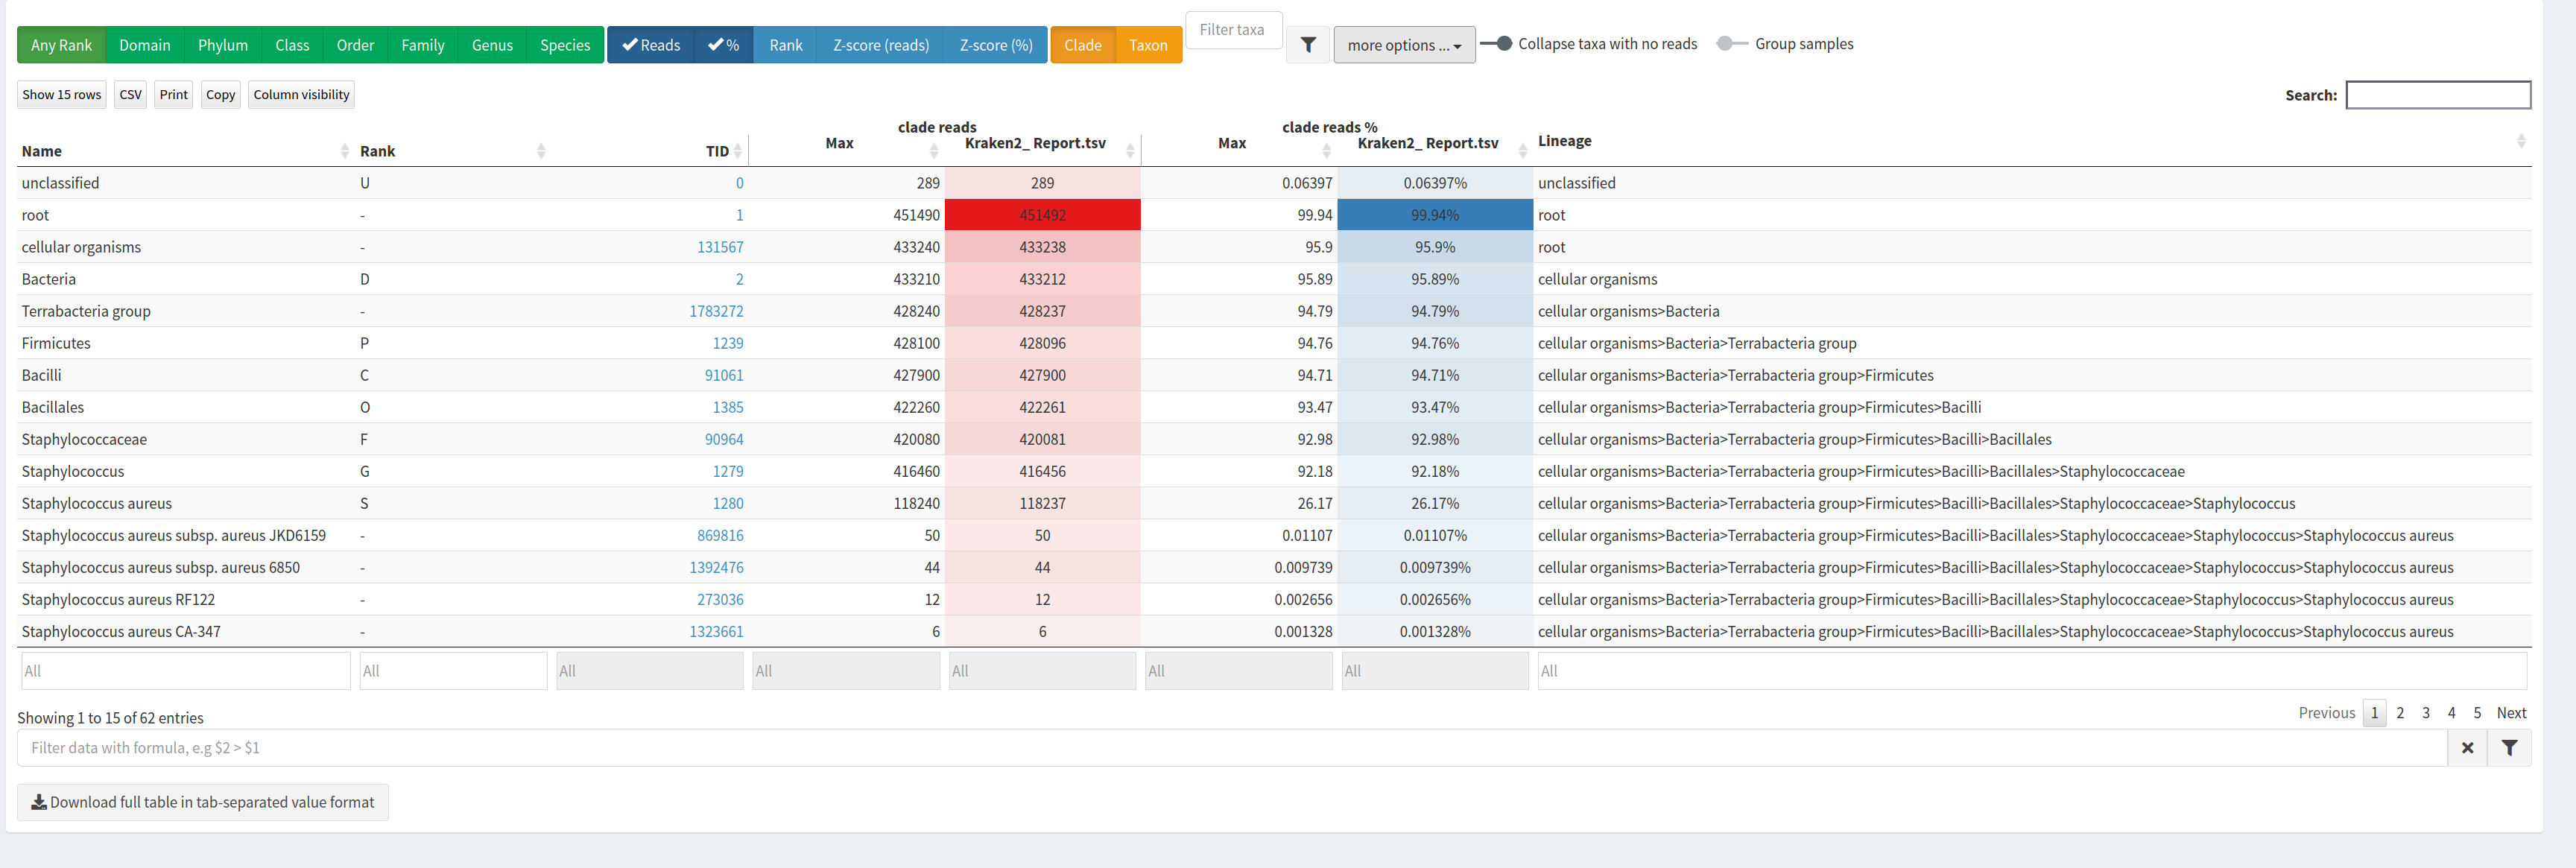
Pavian (pathogen visualization and more) is an interactive visualization tool for metagenomic data. It was developed for the clinical metagenomic problem to find a disease-causing pathogen in a patient sample, but it is useful to analyze and visualize any kind of metagenomics data.
KrakenSave tableResult Overview.
This page shows the summary of the classifications in the selected sample set: