If we analyse DNA from several bacterial strains, we may want to know which genes they have in common and which are unique to some strains.
Pangenomic analysis studies the diversity and evolution of genes and genomes within a group of related organisms. It goes beyond traditional single-genome analysis by examining the collective genomic content of a population, species, or even a larger taxonomic group.
The core genome is the group of genes shared by every genome in the tested set. Gene sequences are similar but not necessarily identical. Core genome SNPs are those SNPs found in the genes in the core genome; i.e. at a particular site, the nucleotide varies. We can use these SNPs to infer relationships between the strains. Some authors have divided the core pangenome in
hard core: families of homologous genes that has at least one copy of the family shared by every genome (100% of genomes)
soft core: those families distributed above a certain threshold (90%)
The accessory genome is the group of genes that are not in all the strains.
Shell: is the part of the pangenome shared by the majority of the genomes in a pangenome. There is not a universally accepted threshold to define the shell genome, some authors consider a gene family as part of the shell pangenome if it shared by more than 50% of the genomes in the pangenome
Cloud: consists of those gene families shared by a minimal subset of the genomes in the pangenome, it includes singletons or genes present in only one of the genomes. It is also known as the peripheral genome. Gene families in this category are often related to ecological adaptation
The pan genome is the sum of the core and accessory genes. That is, a combination of all the genes that are found in the clade of interest.
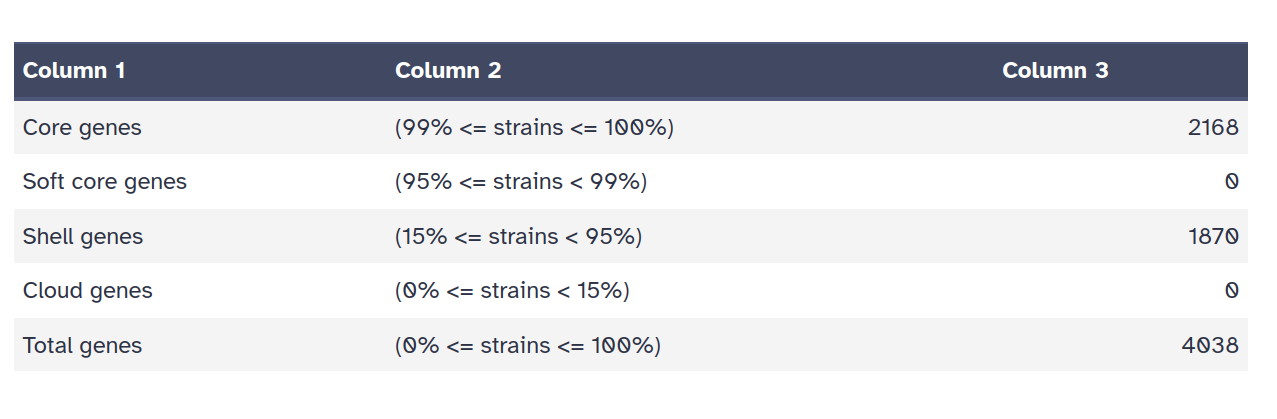
In a study that involves the pangenomes of Staphylococcus aureus, some of them isolated from the international space station, the thresholds used for segmenting the pangenomes were as follows:
Cloud: presence in <10% of the genomes
Shell: presence in 10% to 95% of the genomes
Core , presence in >95% of the genomes
Recently several stand-alone or server-based suites have become available for pangenome analysis: a Review of Pangenome Tools and Recent Studies can be found here
We decided to use Roary
a high speed stand alone pan genome pipeline,
which takes annotated assemblies in GFF3 format (produced by Prokka) and calculates the pan genome.
Roary accepts the annotated genome in GFF3 format as input, per sample (e.g. output from Prokka),
with the strict requirement that the samples must belong to the same species.
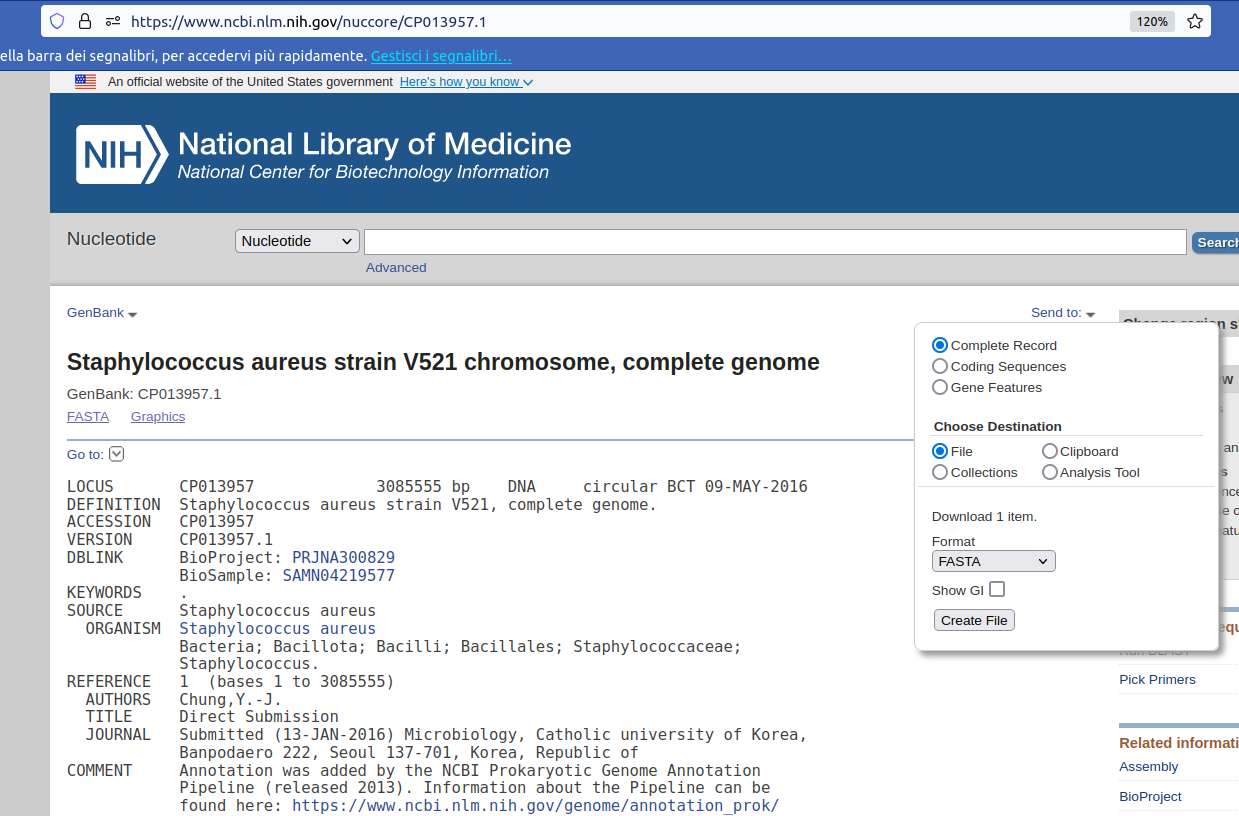
For this tutorial, we will use sequences from different strains of Staphylococcus aureus:
Click on link
Send to
Complete Record
File
Format: FASTA
Create File
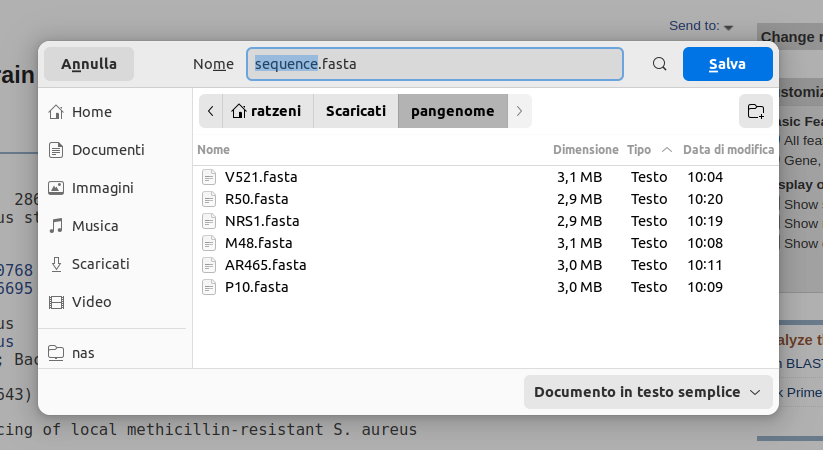
Rename file with strain label
Prokka Tool with the following parameters (leave everything else unchanged):
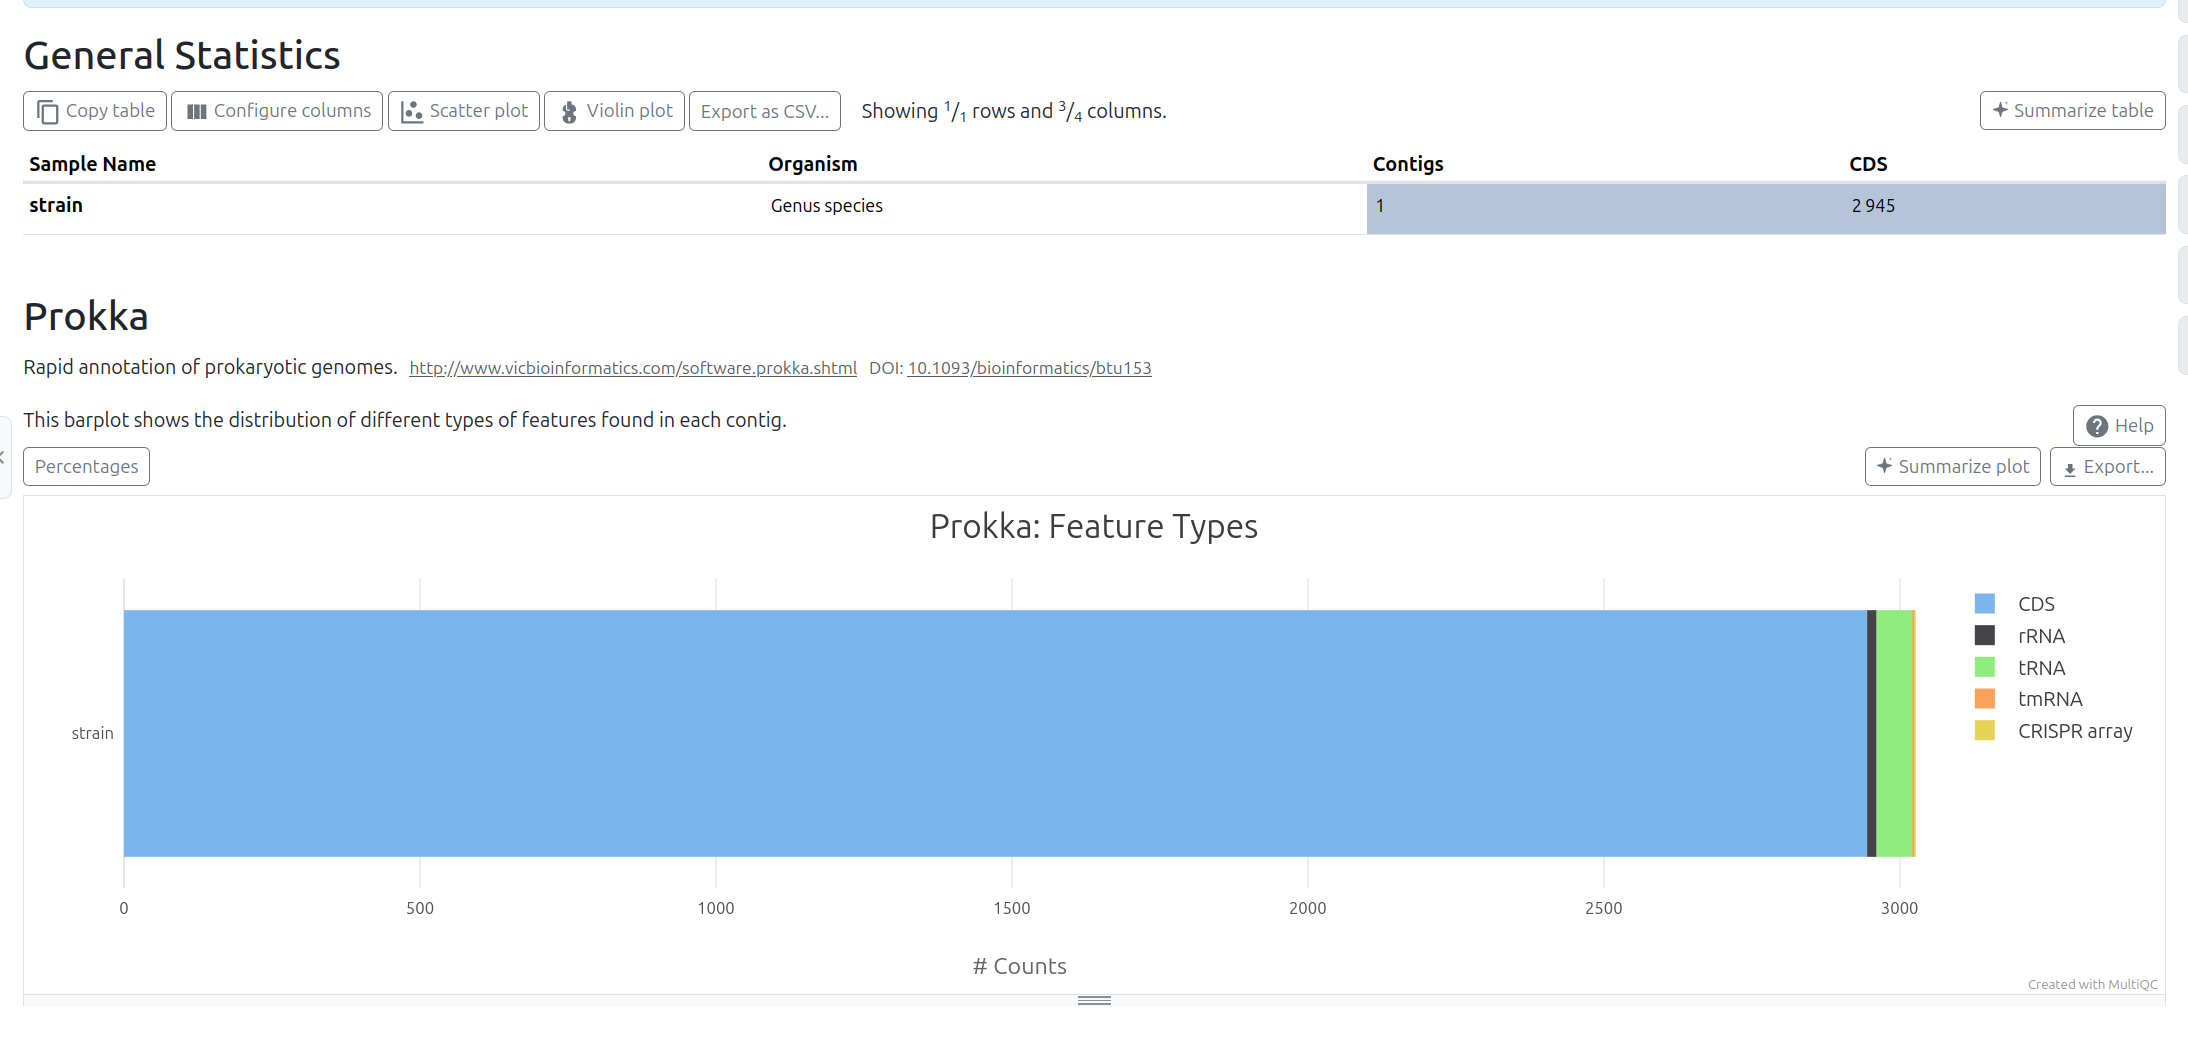
MultiQC tool with following parameters
Roary is widely used in microbiology and bacterial genomics research to study the genomic diversity of bacterial populations,
track the evolution of pathogens, and understand the genetic basis of phenotypic traits.
Starting with a set of annotated prokaryotic genomes, in standard formats like GFF, Roary will be able to:
converts coding sequences into protein sequences
clustered these protein sequences by several methods
further refines clusters into orthologous genes
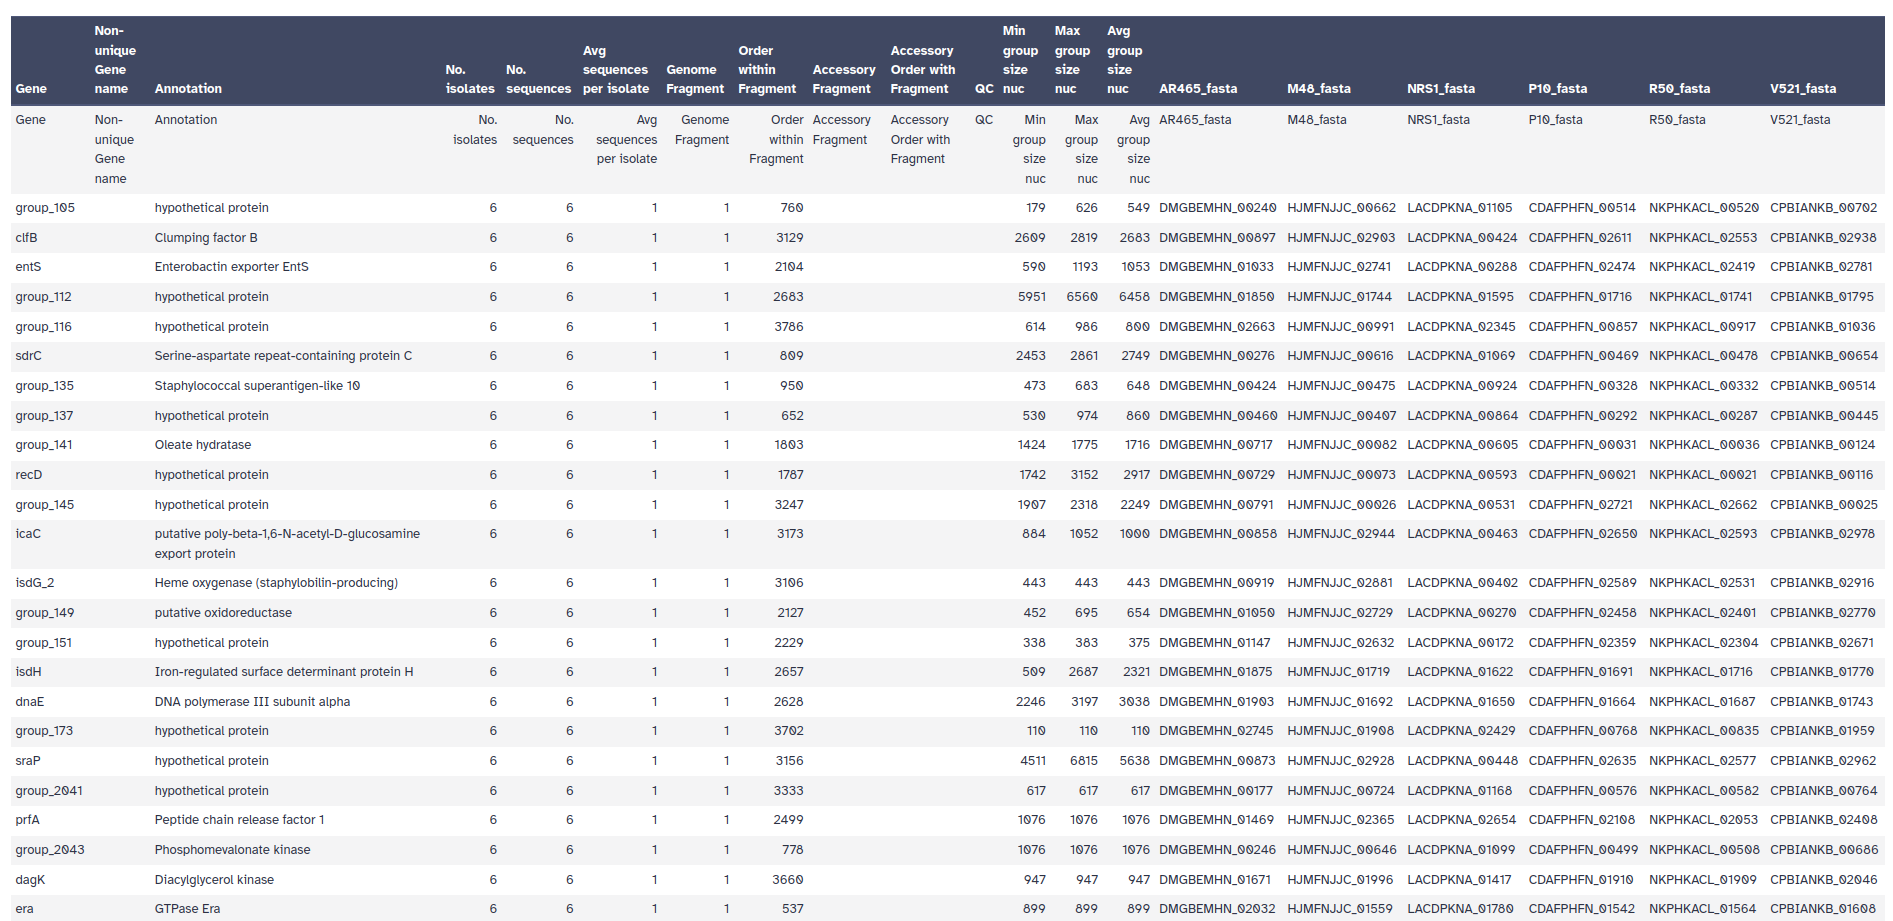
for each sample, determines if gene is present/absent: produces the file gene_presence_absence.csv
uses this gene p/a information to build a tree, using FastTree: produces the file accessory_binary_genes.fa.newick
overall, calculates number of genes that are shared, and unique: produces the file summary_statistics.txt
aligns the core genes (if option used, as above) for downstream analyses
Roary Tool with the following parameters:
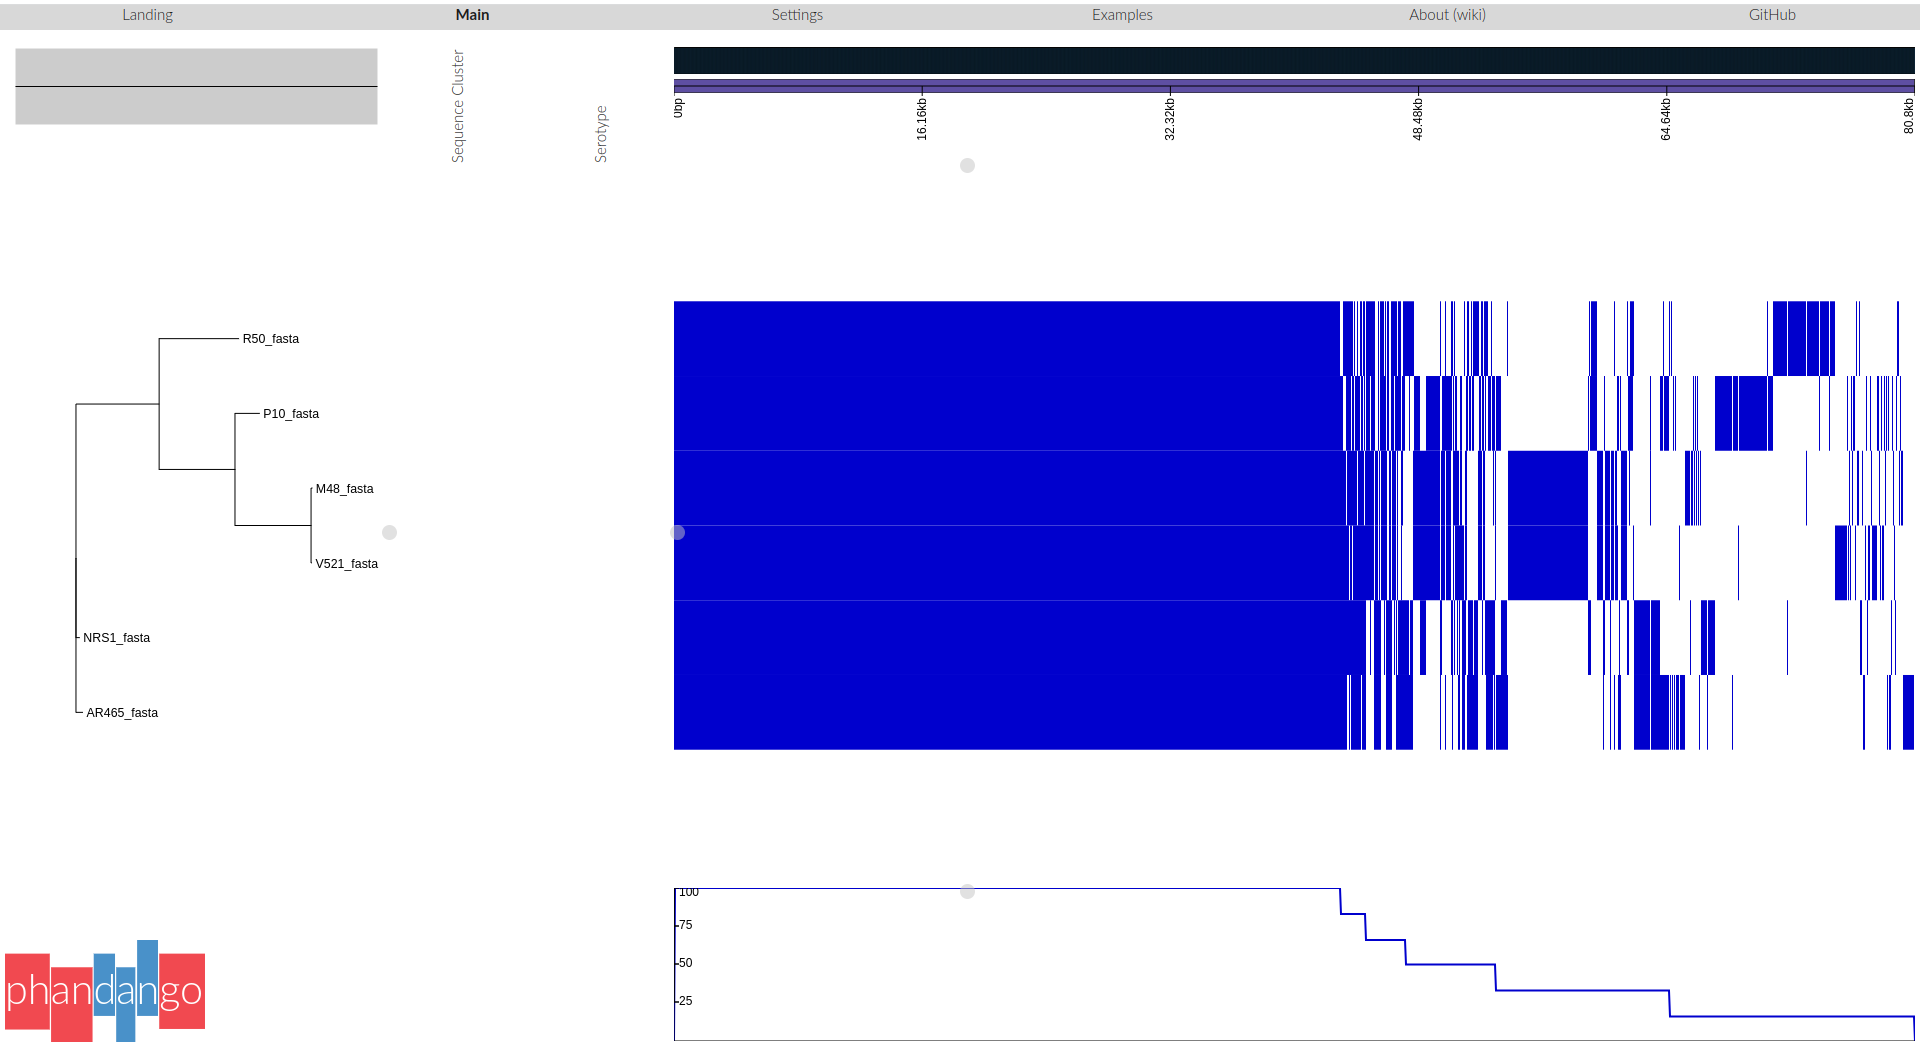
ProkkaRoary produces four main outputs:
Roary has produced an alignment of the core genes. We can use this alignment to infer a phylogenetic tree of the isolates.
Phylogeneitc reconstruction with RaXML Tool with the following parameters:
RoaryInspect the six output files
Click on Result.
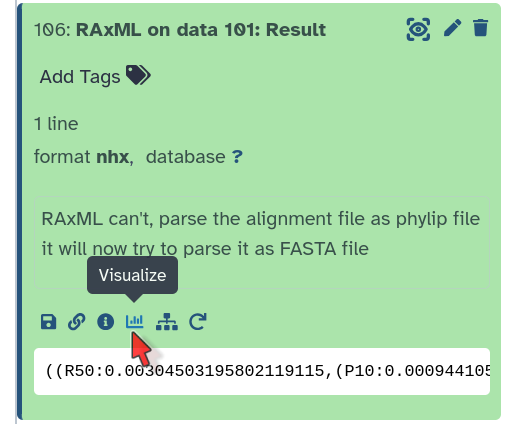
Under the file, click on the Visualize icon (a graph)
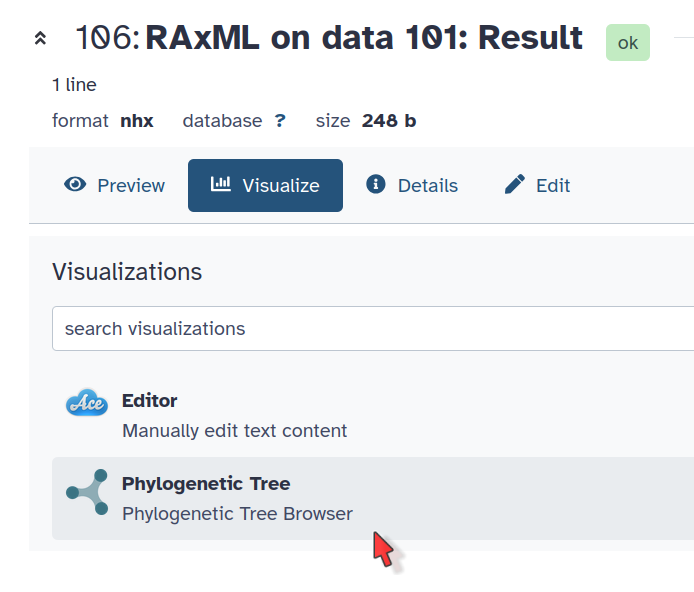
Phylogenetic Tree Visualization
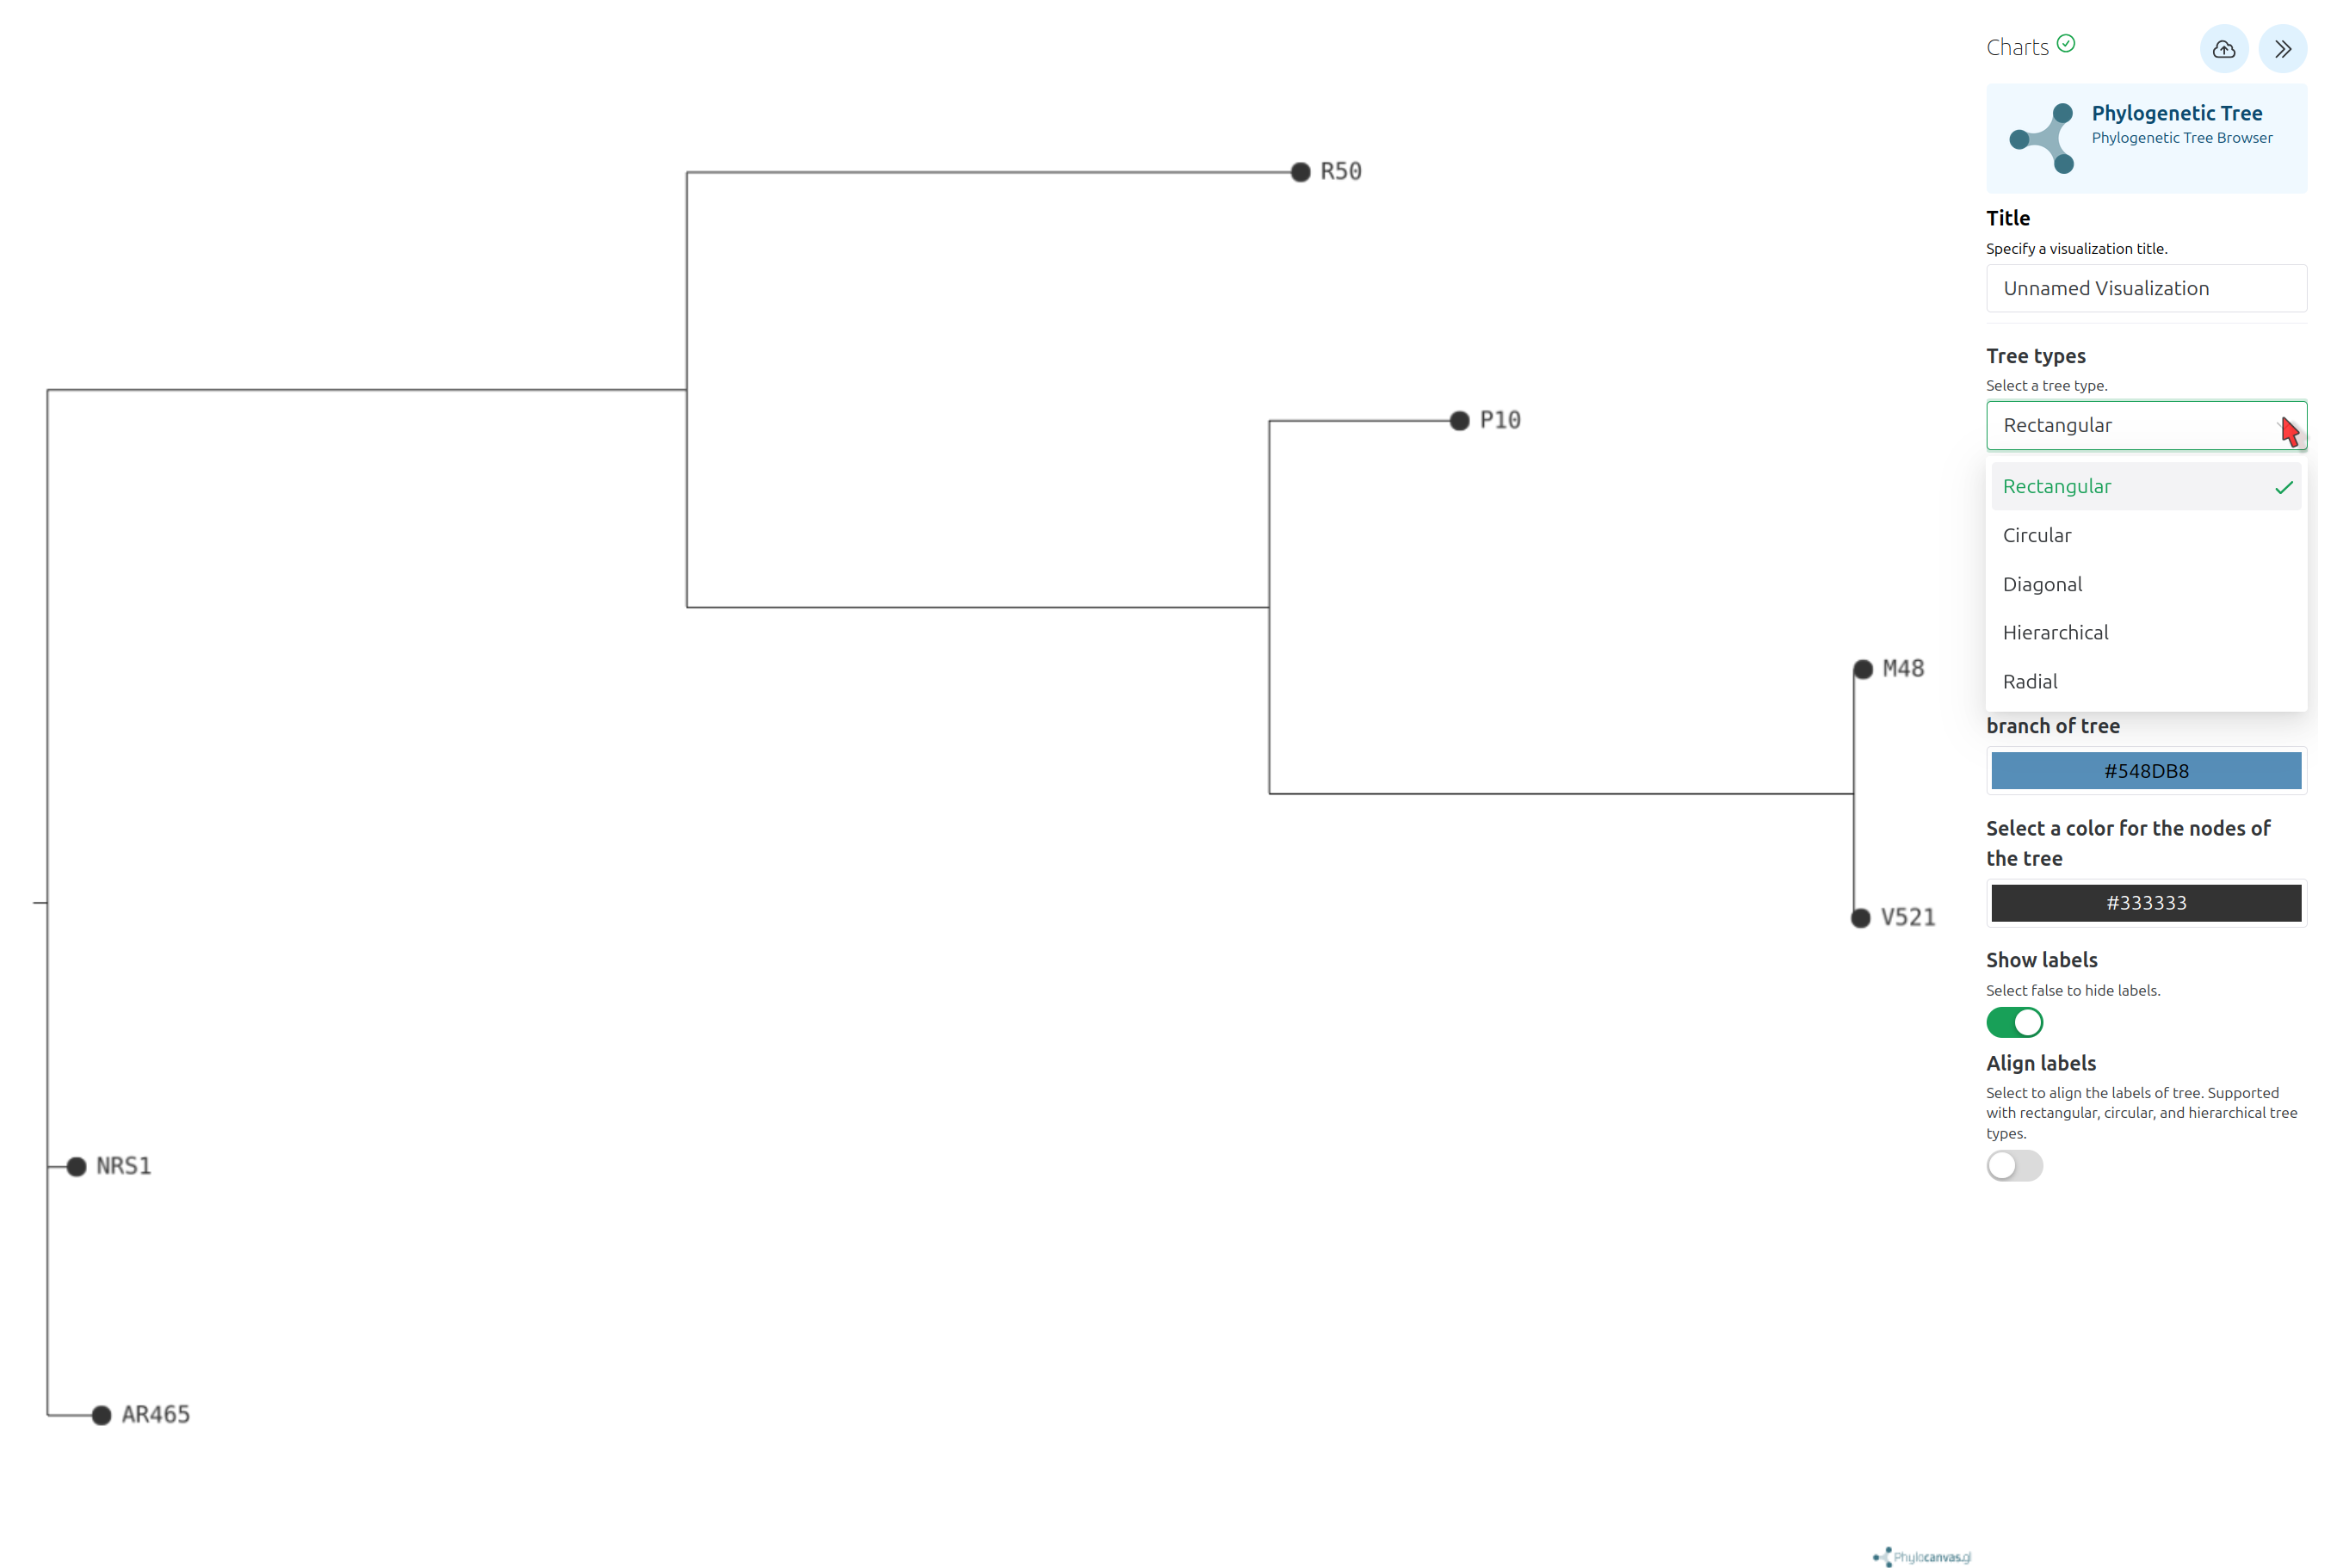
Newick Display Tool with the following parameters:
RaXML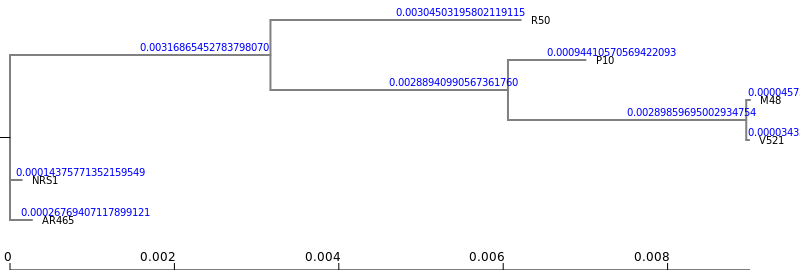
2Newick Display Tool with the following parameters:
Roary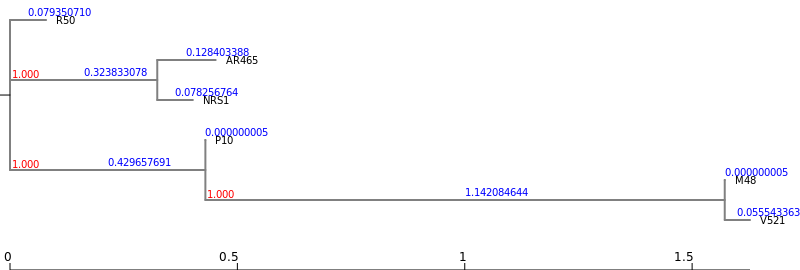
Phylogeneitc reconstruction with RaXMLRoary