Introduction to quality control of NGS raw data: key quality metrics, common issues, and strategies to improve dataset quality.
During sequencing, errors are introduced, such as incorrect nucleotides being called. These are due to the technical limitations of each sequencing platform. Sequencing errors might bias the analysis and can lead to a misinterpretation of the data. Adapters may also be present if the reads are longer than the fragments sequenced and trimming these may improve the number of reads mapped.
Sequence quality control is therefore an essential first step in analysis.
It is necessary to understand, identify and exclude error-types that may impact the interpretation of downstream analysis.
Catching errors early saves time later on.
https://zenodo.org/record/3977236/files/female_oral2.fastq-4143.gz
Each read, representing a fragment of the library, is encoded by 4 lines:
Always begins with @ followed by the information about the read
The actual nucleic sequence
Always begins with a + and contains sometimes the same info in line 1
Has a string of characters which represent the quality scores associated with each base of the nucleic sequence; must have the same number of characters as line 2
So for example, the first sequence in our file is:
@M00970:337:000000000-BR5KF:1:1102:17745:1557 1:N:0:CGCAGAAC+ACAGAGTT
GTGCCAGCCGCCGCGGTAGTCCGACGTGGCTGTCTCTTATACACATCTCCGAGCCCACGAGACCGAAGAACATCTCGTATGCCGTCTTCTGCTTGAAAAAAAAAAAAAAAAAAAACAAAAAAAAAAAAAGAAGCAAATGACGATTCAAGAAAGAAAAAAACACAGAATACTAACAATAAGTCATAAACATCATCAACATAAAAAAGGAAATACACTTACAACACATATCAATATCTAAAATAAATGATCAGCACACAACATGACGATTACCACACATGTGTACTACAAGTCAACTA
+
GGGGGGGGGGGGGGGGGGGGGGGGGGGGGGGGGGGGGGGGGGGGGGGGGGGGGGGGGGGGGFGGGFGGGGGGAFFGGFGGGGGGGGFGGGGGGGGGGGGGGFGGG+38+35*311*6,,31=******441+++0+0++0+*1*2++2++0*+*2*02*/***1*+++0+0++38++00++++++++++0+0+2++*+*+*+*+*****+0**+0**+***+)*.***1**//*)***)/)*)))*)))*),)0(((-((((-.(4(,,))).,(())))))).)))))))-))-(
It means that the fragment named @M00970 corresponds to the DNA sequence
GTGCCAGCCGCCGCGGTAGTCCGACGTGGCTGTCTCTTATACACATCTCCGAGCCCACGAGACCGAAGAACATCTCGTATGCCGTCTTCTGCTTGAAAAAAAAAAAAAAAAAAAACAAAAAAAAAAAAAGAAGCAAATGACGATTCAAGAAAGAAAAAAACACAGAATACTAACAATAAGTCATAAACATCATCAACATAAAAAAGGAAATACACTTACAACACATATCAATATCTAAAATAAATGATCAGCACACAACATGACGATTACCACACATGTGTACTACAAGTCAACTA
And this sequence has been sequenced with a quality
GGGGGGGGGGGGGGGGGGGGGGGGGGGGGGGGGGGGGGGGGGGGGGGGGGGGGGGGGGGGGFGGGFGGGGGGAFFGGFGGGGGGGGFGGGGGGGGGGGGGGFGGG+38+35*311*6,,31=******441+++0+0++0+*1*2++2++0*+*2*02*/***1*+++0+0++38++00++++++++++0+0+2++*+*+*+*+*****+0**+0**+***+)*.***1**//*)***)/)*)))*)))*),)0(((-((((-.(4(,,))).,(())))))).)))))))-))-(
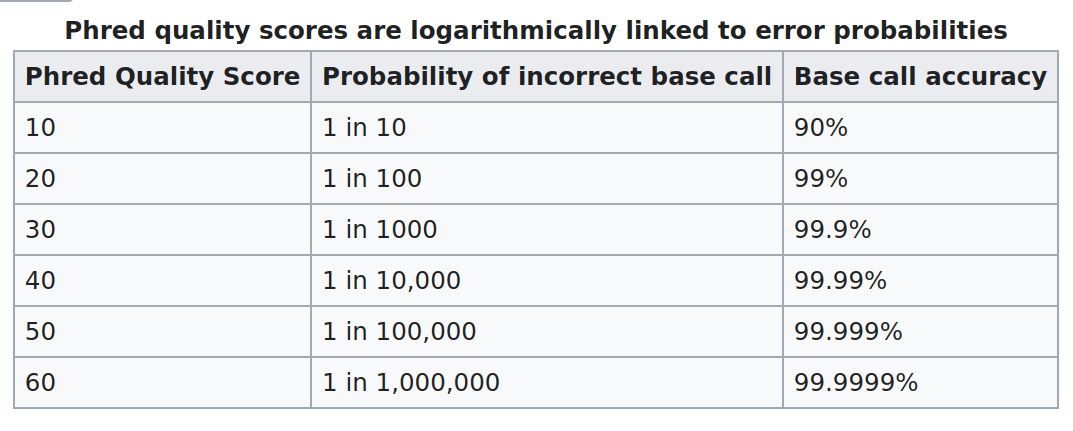
The quality score for each sequence is a string of characters, one for each base of the nucleic sequence, used to characterize the probability of mis-identification of each base. The score is encoded using the ASCII character table
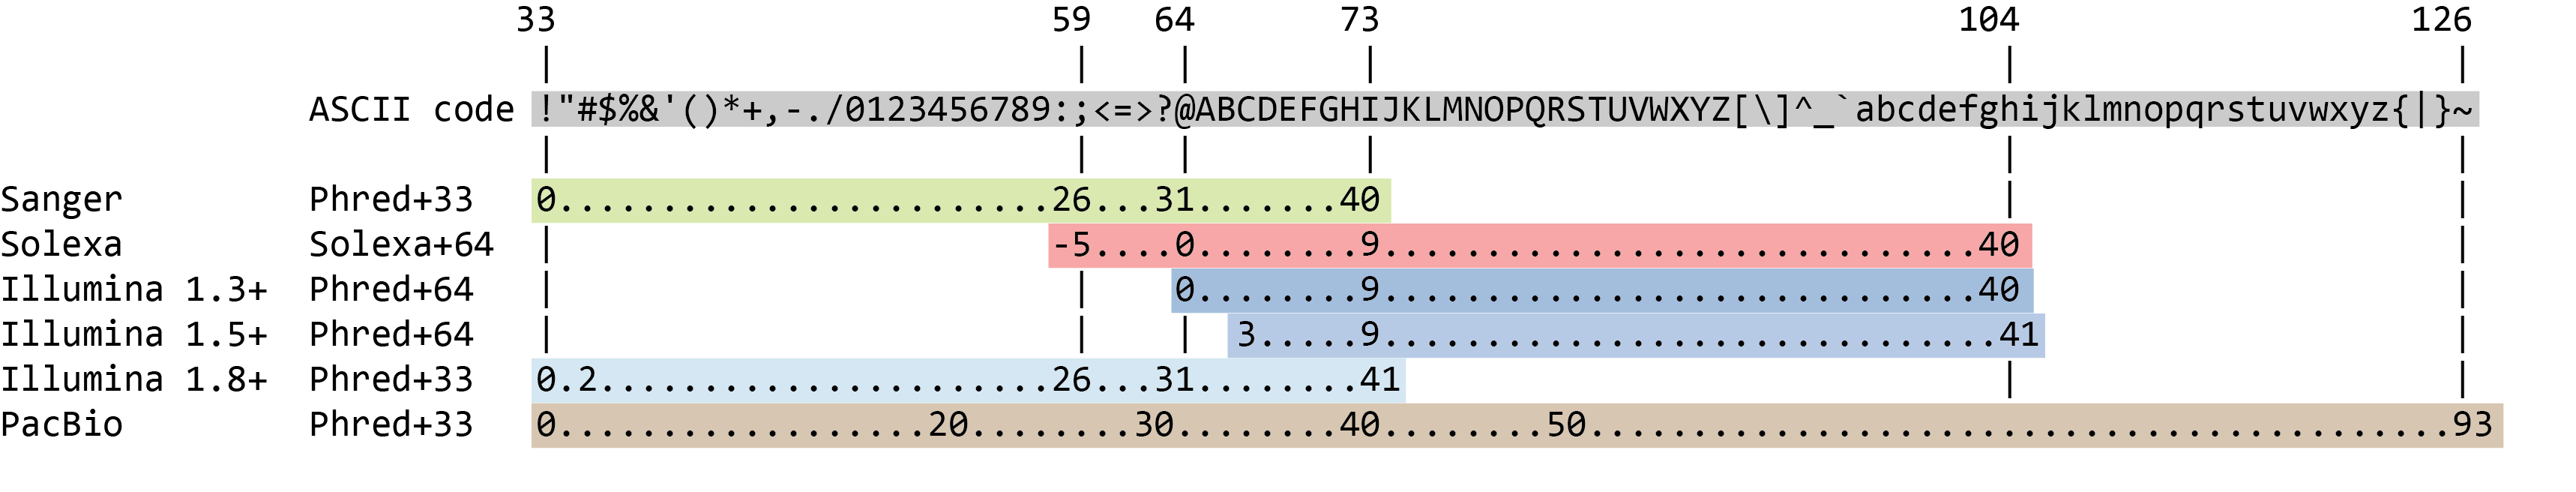
So there is an ASCII character associated with each nucleotide, representing its Phred quality score, the probability of an incorrect base call:
Question
FastQC provides a modular set of analyses which you can use to check whether your data has any problems of which you should be aware before doing any further analysis. We can use it, for example, to assess whether there are known adapters present in the data.
FastQC Tool with the following parameters
With FastQC we can use the per base sequence quality plot to check the base quality of the reads.
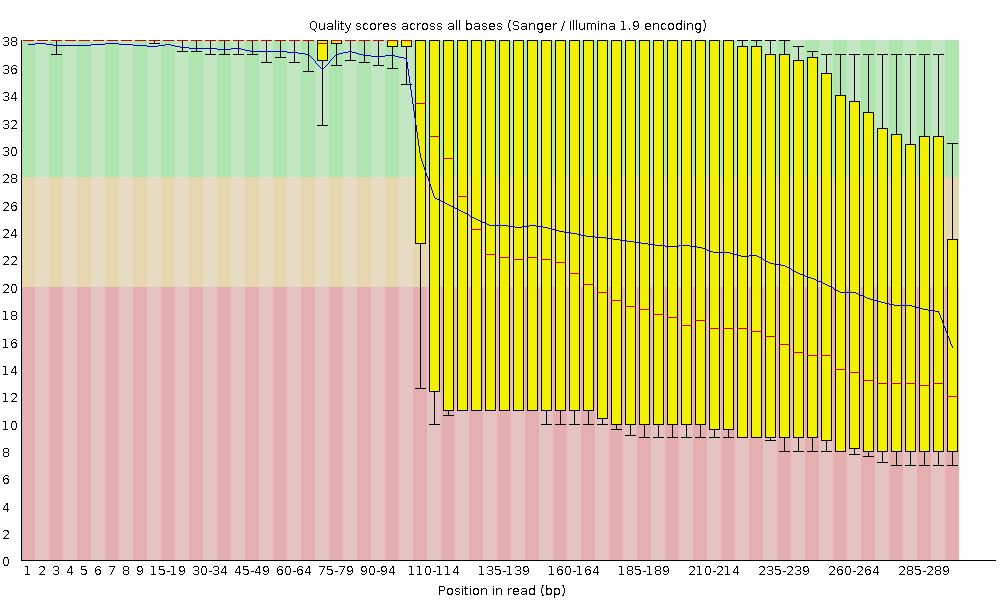
On the x-axis are the base position in the read. In this example, the sample contains reads that are up to 296 bp long.
NB: The x-axis is not always uniform. When you have long reads, some binning is applied to keep things compact. We can see that in our sample. It starts out with individual 1-10 bases. After that, bases are binned across a window a certain number of bases wide
For each position, a boxplot is drawn with:
the median value, represented by the central red line
the inter-quartile range (25-75%), represented by the yellow box
the 10% and 90% values in the upper and lower whiskers
the mean quality, represented by the blue line
When the median quality is below a Phred score of ~20, we should consider trimming away bad quality bases from the sequence. We will explain that process in the Trim and filter section
The y-axis shows the quality scores. The higher the score, the better the base call. The background of the graph divides the y-axis into:
NB: t is normal with all Illumina sequencers for the median quality score to start out lower over the first 5-7 bases and to then rise. The quality of reads on most platforms will drop at the end of the read. This is often due to signal decay or phasing during the sequencing run. The recent developments in chemistry applied to sequencing has improved this somewhat, but reads are now longer than ever.
The following sections go into detail about some of the other plots generated by FastQC.
Note that some plots/modules may give warnings but be normal for the type of data you’re working with,
as discussed below and here
These sections are optional, and if you would like to skip these you can jump into Summarize data with MultiQC
This plot enables you to look at the quality scores from each tile across all of your bases to see if there was a loss in quality associated with only one part of the flowcell. The plot shows the deviation from the average quality for each flowcell tile. The hotter colours indicate that reads in the given tile have worse qualities for that position than reads in other tiles.
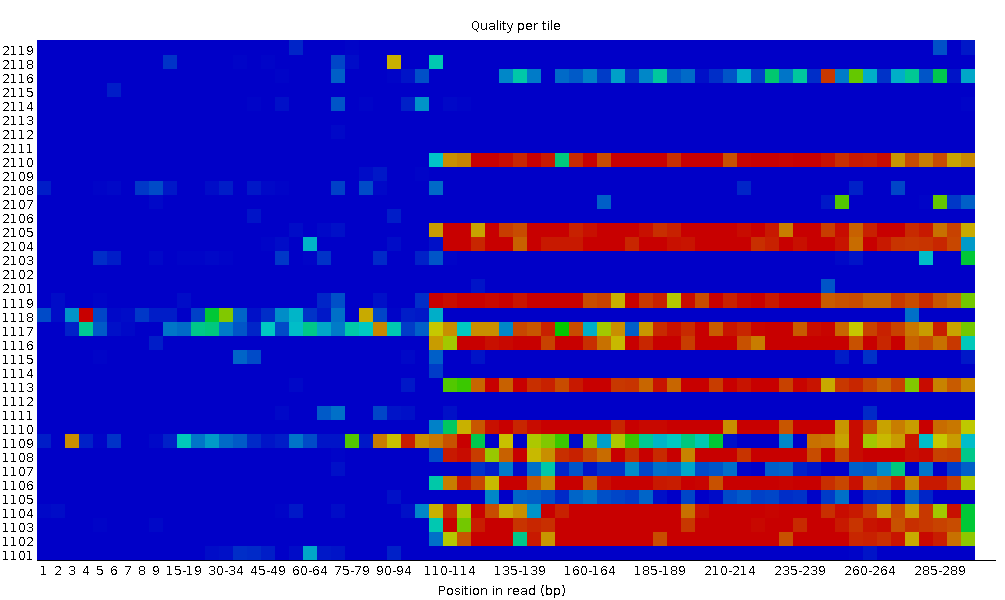
With this sample, you can see that certain tiles show consistently poor quality, especially from ~100bp onwards. A good plot should be blue all over.
It plots the average quality score over the full length of all reads on the x-axis and gives the total number of reads with this score on the y-axis:
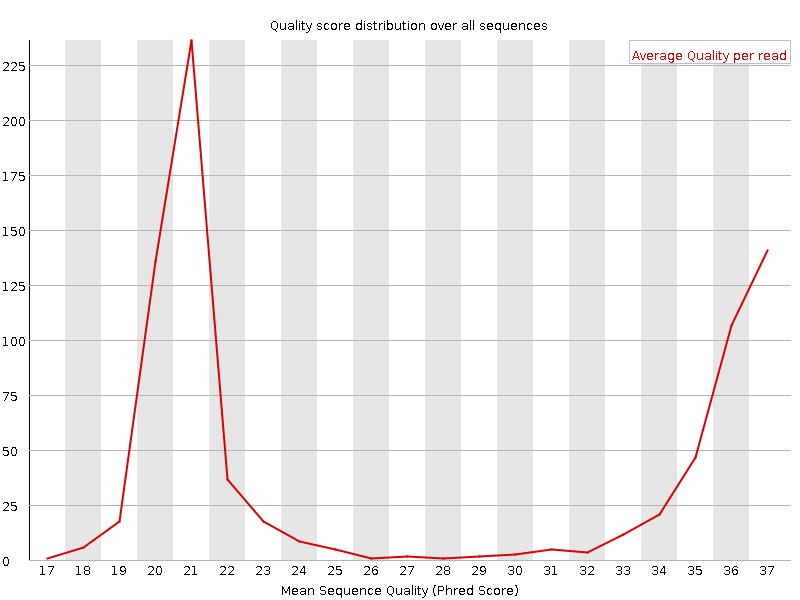
The distribution of average read quality should be tight peak in the upper range of the plot.
It plots the percentage of each of the four nucleotides (T, C, A, G) at each position across all reads in the input sequence file. As for the per base sequence quality, the x-axis is non-uniform.
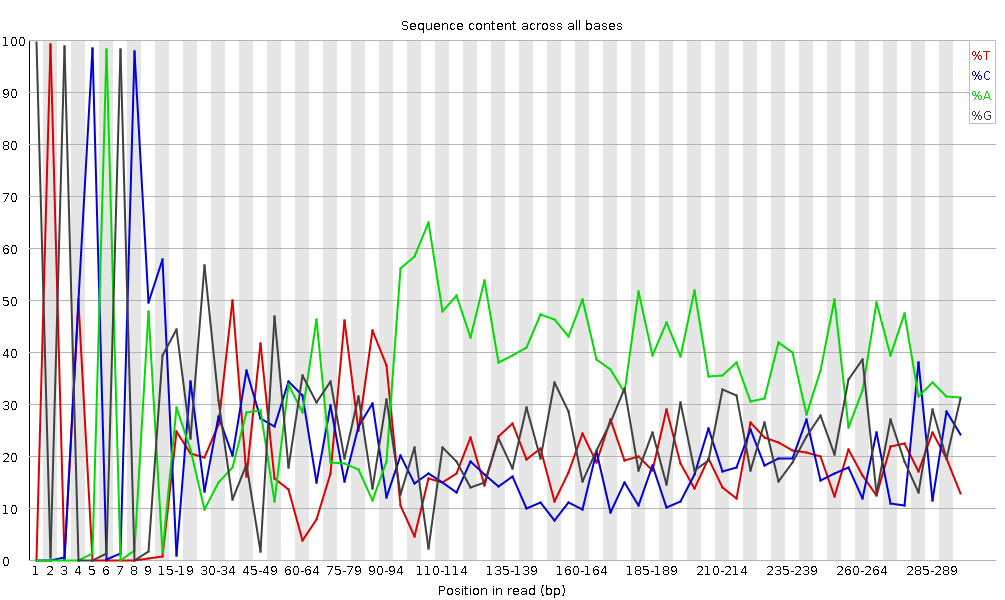
In a random library we would expect that there would be little to no difference between the four bases.
The proportion of each of the four bases should remain relatively constant over the length of the read with %A=%T and %G=%C,
and the lines in this plot should run parallel with each other.
This is amplicon data, where 16S DNA is PCR amplified and sequenced, so we’d expect this plot to have some bias and not show a random distribution.
The plot displays the number of reads vs. percentage of bases G and C per read. It is compared to a theoretical distribution assuming an uniform GC content for all reads, expected for whole genome shotgun sequencing, where the central peak corresponds to the overall GC content of the underlying genome.
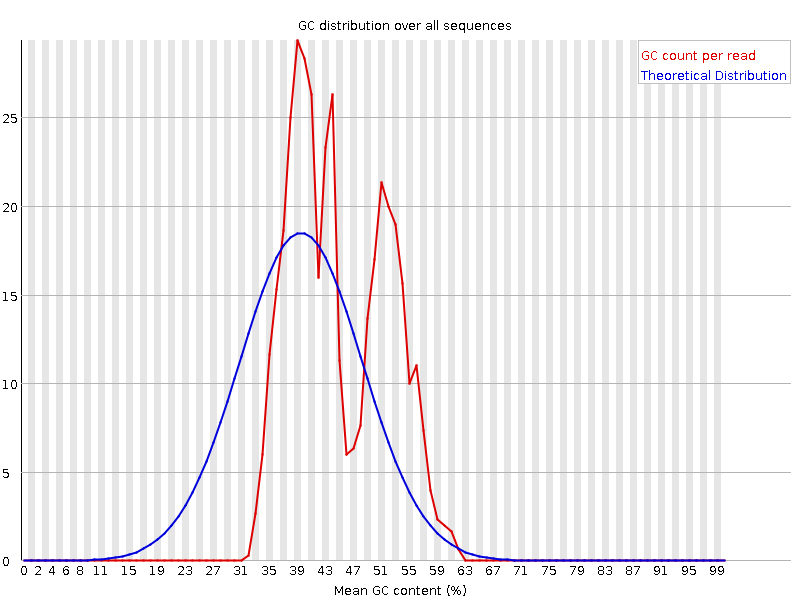
An unusually-shaped distribution could indicate a contaminated library or some other kind of biased subset. A shifted normal distribution indicates some systematic bias, which is independent of base position.
But there are also other situations in which an unusually-shaped distribution may occur. For example, it may be normal if it is amplicon data or you have highly abundant RNA-seq transcripts.
If a sequencer is unable to make a base call with sufficient confidence, it will write an “N” instead of a conventional base call. This plot displays the percentage of base calls at each position or bin for which an N was called.
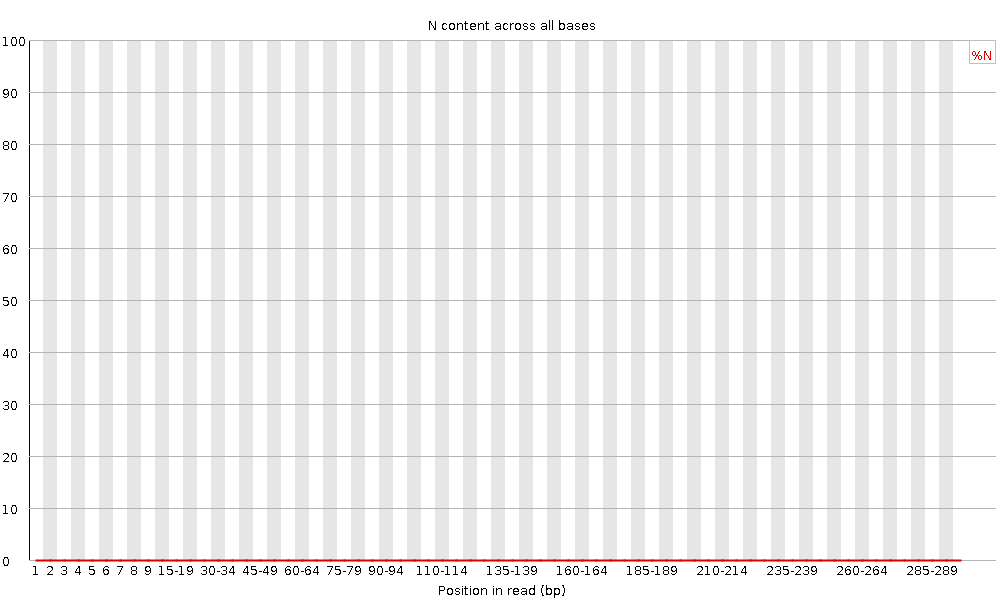
It’s not unusual to see a very high proportion of Ns appearing in a sequence, especially near the end of a sequence. But this curve should never rises noticeably above zero. If it does this indicates a problem occurred during the sequencing run
The plot shows the distribution of fragment sizes in the file which was analysed.
In many cases this will produce a simple plot showing a peak only at one size, but for variable length FASTQ files this will show the relative amounts of each different size of sequence fragment
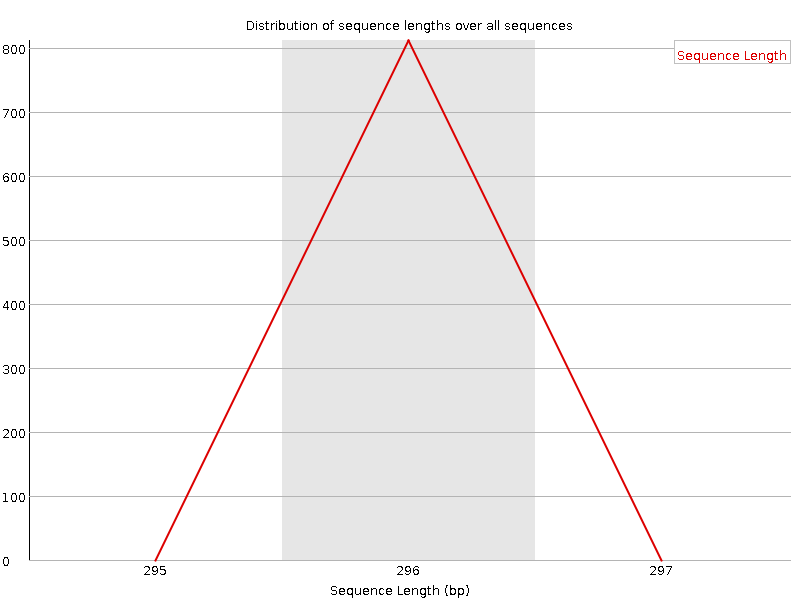
There are two lines on the plot:
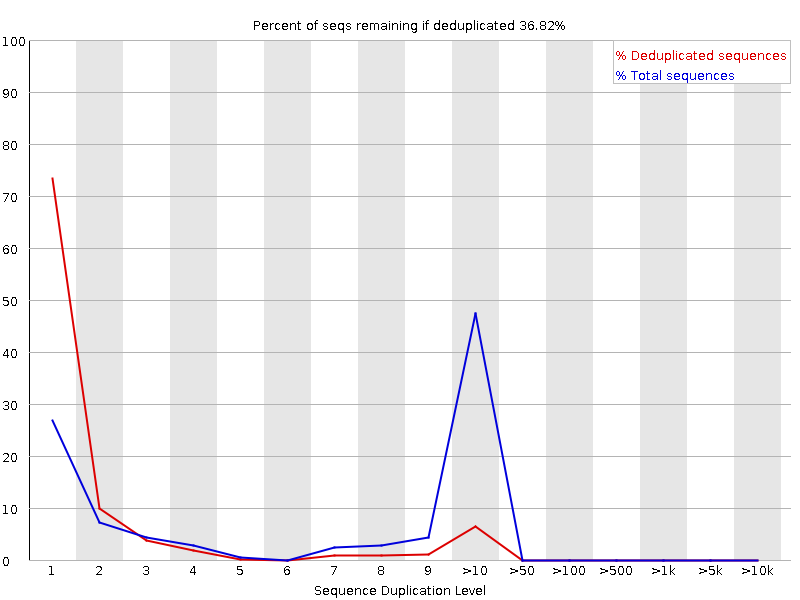
For whole genome shotgun data it is expected that nearly 100% of your reads will be unique (appearing only 1 time in the sequence data).
Two sources of duplicate reads can be found:
PCR duplication in which library fragments have been over-represented due to biased PCR enrichment
Truly over-represented sequences such as very abundant transcripts in an RNA-Seq library or in amplicon data (like this sample)
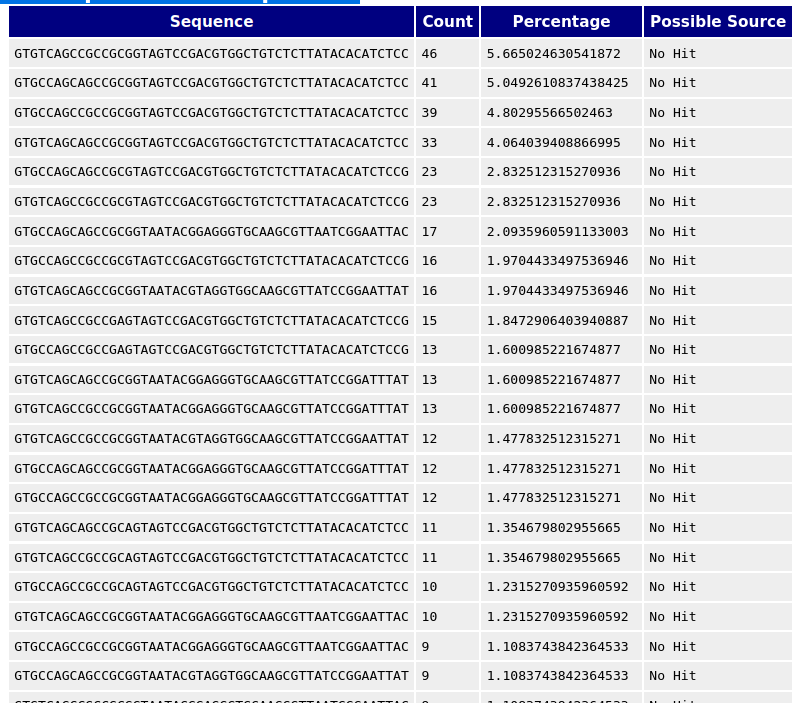
A normal high-throughput library will contain a diverse set of sequences, with no individual sequence making up a tiny fraction of the whole.
Finding that a single sequence is very over-represented in the set either means that it is highly biologically significant, or indicates that the library is contaminated, or not as diverse as expected.
The plot shows the cumulative percentage of reads with the different adapter sequences at each position.
Once an adapter sequence is seen in a read it is counted as being present right through to the end of the read so the percentage increases with the read length.
FastQC can detect some adapters by default (e.g. Illumina, Nextera), for others we could provide a contaminants file as an input to the FastQC tool.
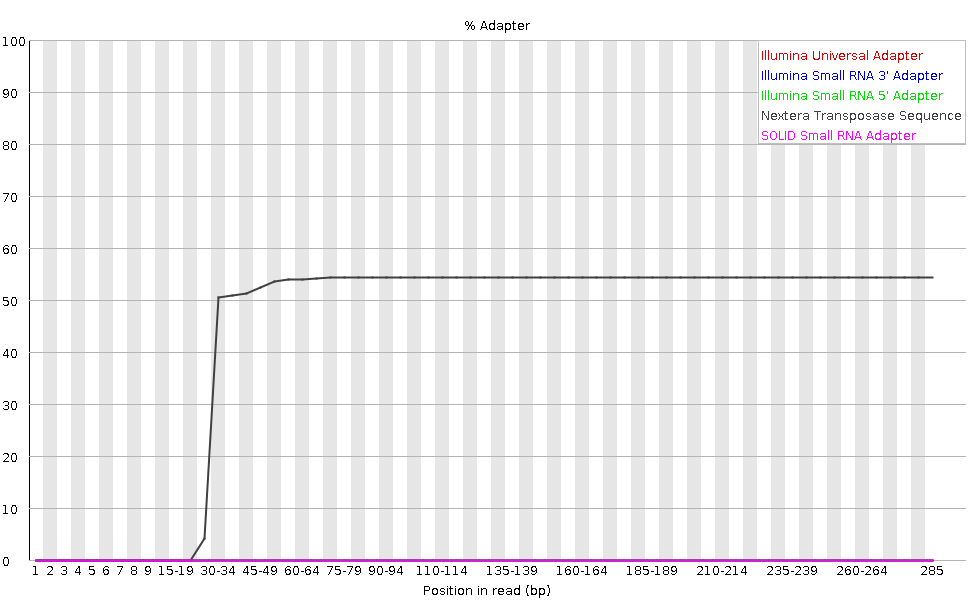
Cutadapt to remove this adapter.
We will explain that process in the Trim and filter sectionIn small RNA libraries, we typically have a relatively small set of unique, short sequences. Small RNA libraries are not randomly sheared before adding sequencing adapters to their ends: all the reads for specific classes of microRNAs will be identical. It will result in:
Extremely biased per base sequence content
Extremely narrow distribution of GC content
Very high sequence duplication levels
Abundance of overrepresented sequences
Read-through into adapters
Amplicon libraries are prepared by PCR amplification of a specific target. For example, the V4 hypervariable region of the bacterial 16S rRNA gene. All reads from this type of library are expected to be nearly identical. It will result in:
Extremely biased per base sequence content
Extremely narrow distribution of GC content
Very high sequence duplication levels
Abundance of overrepresented sequences
With Bisulfite or methylation sequencing, the majority of the cytosine (C) bases are converted to thymine (T). It will result in:
Biased per base sequence content
Biased per sequence GC content
Any library type may contain a very small percentage of adapter dimer (i.e. no insert) fragments. They are more likely to be found in amplicon libraries constructed entirely by PCR (by formation of PCR primer-dimers) than in DNA-Seq or RNA-Seq libraries constructed by adapter ligation.
If a sufficient fraction of the library is adapter dimer it will become noticeable in the FastQC report:
Drop in per base sequence quality after base 60
Possible bi-modal distribution of per sequence quality scores
Distinct pattern observed in per bases sequence content up to base 60
Spike in per sequence GC content
Overrepresented sequence matching adapter
Adapter content > 0% starting at base 1
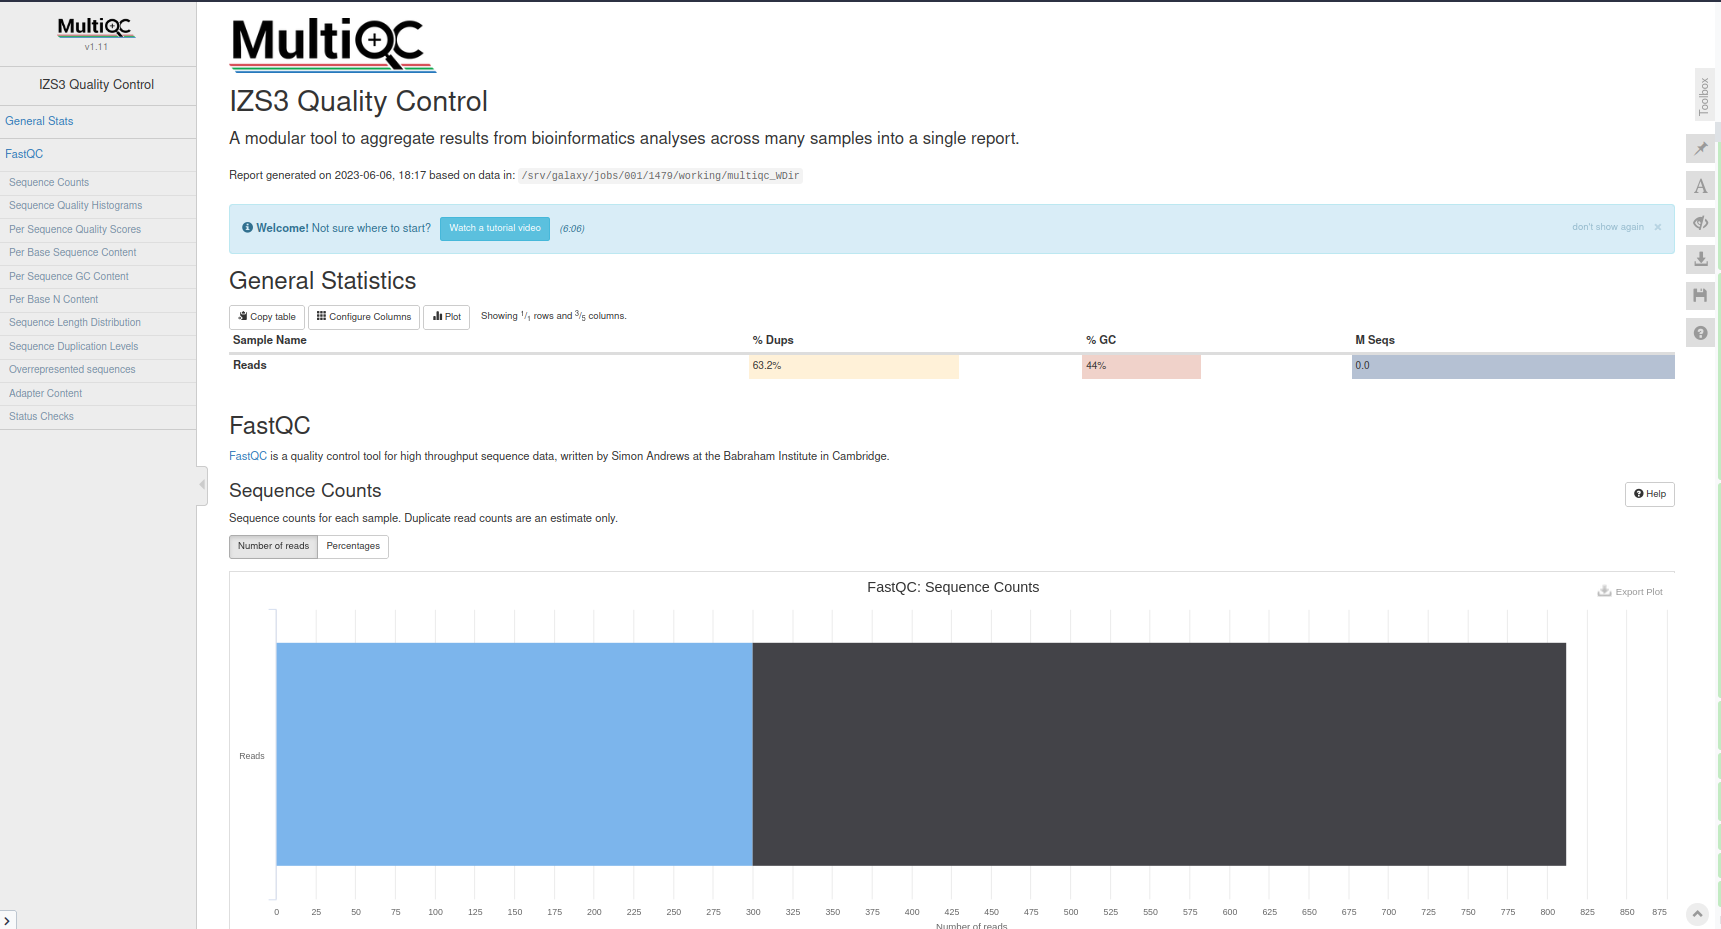
MultiQC aggregates results from bioinformatics analyses across many samples into a single report. It takes results of multiple analyses and creates a report that can be viewed as a single beautiful web-page. It’s a general use tool, perfect for summarizing the output from numerous bioinformatics tools.
MultiQC with the following parameters:
The quality drops in the middle of these sequences. This could cause bias in downstream analyses with these potentially incorrectly called nucleotides. Sequences must be treated to reduce bias in downstream analysis. Trimming can help to increase the number of reads the aligner or assembler are able to succesfully use, reducing the number of reads that are unmapped or unassembled.
In general, quality treatments include:
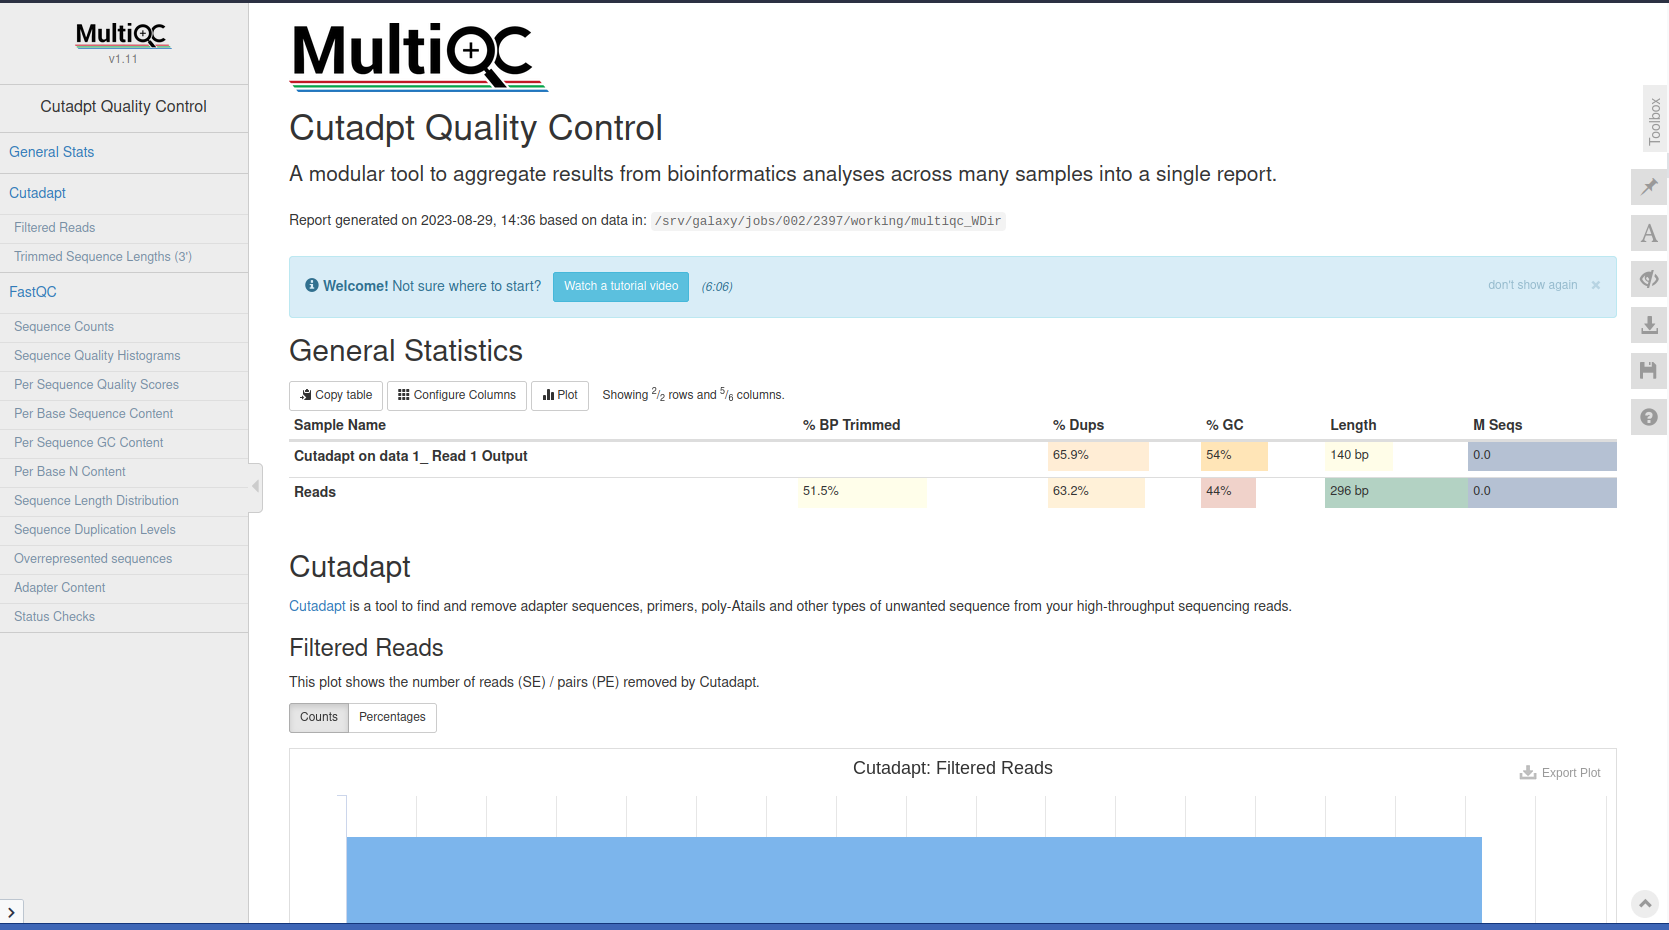
Cutadapt is a tool that enhances sequence quality by automating adapter trimming as well as quality control.
Trim low-quality bases from the ends. Quality trimming is done before any adapter trimming. We will set the quality threshold as 20, a commonly used threshold, see more here.
Trim adapter. For that we need to supply the sequence of the adapter. In this sample, Nextera is the adapter that was detected. We can find the sequence of the Nextera adapter on the Illumina website here CTGTCTCTTATACACATCT. We will trim that sequence from the 3’ end of the reads.
Filter out sequences with length < 20 after trimming
Cutadapt Tool with the following parameters:
Inspect the generated txt file
Questions
FastQC Tool with the following parameters
MultiQC with the following parameters:
Trim Galore! is a wrapper script to automate quality and adapter trimming as well as quality control, with some added functionality to remove biased methylation positions for RRBS sequence files (for directional, non-directional (or paired-end) sequencing).
TrimGalore! with the following parameters:
FastQC Tool with the following parameters
MultiQC with the following parameters:
In this tutorial we checked the quality of FASTQ files to ensure that their data looks good before inferring any further information. This step is the usual first step for analyses on NGS data.
Perform quality control on every dataset before running any other bioinformatics analysis
Assess the quality metrics and improve quality if necessary
Check the impact of the quality control
Different tools are available to provide additional quality metrics
For paired-end reads analyze the forward and reverse reads together
Multiples datasets (single or paired-end) can be grouped in collection